GIANT: The Artometrics of A San Francisco Dynasty

The San Francisco Giants have been playing professional baseball since 1883. That is not a typo. The franchise that now calls Oracle Park home started as the New York Gothams — a team that predates the automobile, the lightbulb's commercial adoption, and the modern World Series by twenty years. In the 141 seasons since, the Giants have won eight World Series titles, relocated across a continent, played in three stadiums, and cycled through dynasties separated by decades of near-misses. No franchise in American professional sports carries a longer or more complicated arc.
This report uses the Lahman Baseball Database to trace that arc across three dimensions: how the franchise has won and lost over time, how a new ballpark rebuilt the organization's economic foundation, and how the 2010–2014 dynasty managed to win three championships as a mid-tier spender in one of the most expensive markets in the sport. The win percentage data runs through 2024; payroll data covers 1985–2016, the period for which the Lahman salary table is complete — capturing every era of the dynasty and the years that immediately preceded it. The story it tells is less about any single player or manager than about the structural conditions that made sustained winning possible.
The primary data source for this report is the Lahman Baseball Database, accessed via the Lahman R package. The database is maintained by Sean Lahman and updated annually; it draws from Baseball Reference and is considered the standard reference for longitudinal MLB franchise analysis. The Teams table provides season-level records for wins, losses, and attendance for every MLB franchise from 1871 through the most recent completed season. The Giants appear under two team IDs: NY1 for the New York era (1883–1957) and SFN for the San Francisco era (1958–present).
The Salaries table covers individual player salaries from 1985 through 2016. Total team payroll is computed by summing all player salaries within a given team and season, then ranking teams within each year to produce a relative payroll rank. This approach has known limitations — discussed in the Limitations section — but produces a consistent, comparable series across three decades of Giants baseball. The salary data is complete for all 30 MLB teams across the dynasty window (2010–2014), which is the period of primary analytical interest.
Attendance figures are official reported totals from Baseball Reference via the Lahman Teams table. They cover every San Francisco season from 1958 through the most recent year available and include the 2020 season, which was played without fans due to the COVID-19 pandemic. Pre-1958 attendance figures exist in the dataset but are excluded from Chart 2, which focuses on the SF era and the stadium transition story.
Win percentage for Chart 1 is computed directly from the W and L columns as W / (W + L). Short seasons — the 1994 and 1995 strike-shortened years, the 2020 pandemic season — are included without adjustment, which produces visible outliers in the raw data. The smoothed trend overlay uses a LOESS fit with a span of 0.15 and is less sensitive to single-season anomalies than the raw line.
-- SAN FRANCISCO GIANTS: CORE AGGREGATIONS
-- Source: Lahman Baseball Database (via Baseball Reference)
-- Display-only — analysis runs in R; SQL documents the logic

-- ── 1. FRANCHISE WIN % BY DECADE ──────────────────────────────────

SELECT
    FLOOR(yearID / 10) * 10        AS decade,
    COUNT(*)                        AS seasons,
    ROUND(SUM(W) * 1.0
          / (SUM(W) + SUM(L)), 3)  AS win_pct,
    SUM(CASE WHEN yearID IN (
        1905,1921,1922,1933,1954,
        2010,2012,2014)
        THEN 1 ELSE 0 END)         AS ws_titles
FROM teams
WHERE teamID IN ('NY1', 'SFN')
GROUP BY decade
ORDER BY decade;

-- Result: 1900s-1950s avg ~.560. Candlestick era dips to ~.490.
-- Oracle era spikes to ~.540 during dynasty, regression after.


-- ── 2. ATTENDANCE BY STADIUM ERA ──────────────────────────────────

SELECT
    CASE
        WHEN yearID <= 1959 THEN 'Seals Stadium'
        WHEN yearID <= 1999 THEN 'Candlestick Park'
        ELSE                     'Oracle Park'
    END                          AS stadium_era,
    COUNT(*)                     AS seasons,
    ROUND(AVG(attendance), 0)    AS avg_attendance,
    MIN(attendance)              AS min_attendance,
    MAX(attendance)              AS max_attendance
FROM teams
WHERE teamID = 'SFN'
  AND attendance IS NOT NULL
GROUP BY stadium_era
ORDER BY MIN(yearID);

-- Candlestick avg ~1.6M. Oracle avg ~3.1M.
-- Oracle floor (~2.8M) exceeds Candlestick ceiling in good years.


-- ── 3. PAYROLL RANK VS. WINS — DYNASTY WINDOW ─────────────────────

WITH team_payroll AS (
    SELECT
        yearID,
        teamID,
        SUM(salary)              AS total_payroll
    FROM salaries
    GROUP BY yearID, teamID
),
ranked AS (
    SELECT
        yearID,
        teamID,
        total_payroll,
        RANK() OVER (
            PARTITION BY yearID
            ORDER BY total_payroll DESC
        )                        AS payroll_rank,
        COUNT(*) OVER (
            PARTITION BY yearID
        )                        AS n_teams
    FROM team_payroll
)
SELECT
    r.yearID,
    r.payroll_rank,
    r.total_payroll,
    t.W,
    ROUND(t.W * 1.0 / (t.W + t.L), 3) AS win_pct
FROM ranked r
JOIN teams t
  ON r.yearID = t.yearID
 AND r.teamID = t.teamID
WHERE r.teamID = 'SFN'
  AND r.yearID BETWEEN 1985 AND 2016
ORDER BY r.yearID;

-- 2010: rank 9/30, 92 wins. 2012: rank 8/30, 94 wins.
-- 2014: rank 4/30, 88 wins. Efficiency peaked early in window.
# San Francisco Giants — Artometrics Python EDA
# Purpose: Dataset diagnostics before R chart build
# Source: Lahman Baseball Database

import pandas as pd
import numpy as np

# ── Load from Lahman CSV exports (Chadwick Bureau mirror) ─────────
teams_url    = "https://raw.githubusercontent.com/chadwickbureau/baseballdatabank/master/core/Teams.csv"
salaries_url = "https://raw.githubusercontent.com/chadwickbureau/baseballdatabank/master/core/Salaries.csv"

teams    = pd.read_csv(teams_url)
salaries = pd.read_csv(salaries_url)

# ── Filter to Giants franchise ────────────────────────────────────
giants     = teams[teams["teamID"].isin(["NY1", "SFN"])].copy()
giants_sal = salaries[salaries["teamID"] == "SFN"].copy()

print(f"Giants seasons:         {len(giants)}")
print(f"Giants salary records:  {len(giants_sal):,}")
print(f"Salary years:           {giants_sal['yearID'].min()}-{giants_sal['yearID'].max()}")

# ── Win % by era ──────────────────────────────────────────────────
giants["win_pct"] = giants["W"] / (giants["W"] + giants["L"])
giants["era"] = pd.cut(
    giants["yearID"],
    bins=[0, 1957, 1999, 2009, 2014, 2100],
    labels=["New York", "Candlestick", "Building", "Dynasty", "Post-Dynasty"]
)

era_summary = (
    giants.groupby("era")["win_pct"]
    .agg(["mean", "median", "count"])
    .round(3)
)
print("\n── WIN % BY ERA ─────────────────────────────────────────")
print(era_summary)

# ── Attendance by stadium era ─────────────────────────────────────
sf = giants[giants["teamID"] == "SFN"].copy()
sf["stadium"] = pd.cut(
    sf["yearID"],
    bins=[0, 1959, 1999, 2100],
    labels=["Seals Stadium", "Candlestick Park", "Oracle Park"]
)

att = (
    sf[sf["attendance"].notna()]
    .groupby("stadium")["attendance"]
    .agg(["mean", "min", "max", "count"])
    .round(0)
)
print("\n── ATTENDANCE BY STADIUM ERA ────────────────────────────")
print(att)

# ── Dynasty payroll ranks ─────────────────────────────────────────
pay = (
    salaries.groupby(["yearID", "teamID"])["salary"]
    .sum().reset_index()
    .rename(columns={"salary": "total_payroll"})
)
pay["payroll_rank"] = (
    pay.groupby("yearID")["total_payroll"]
    .rank(ascending=False, method="min")
)

dynasty = pay[
    (pay["teamID"] == "SFN") &
    (pay["yearID"].isin([2010, 2012, 2014]))
]
print("\n── DYNASTY PAYROLL RANKS ────────────────────────────────")
print(dynasty[["yearID", "total_payroll", "payroll_rank"]]
      .to_string(index=False))
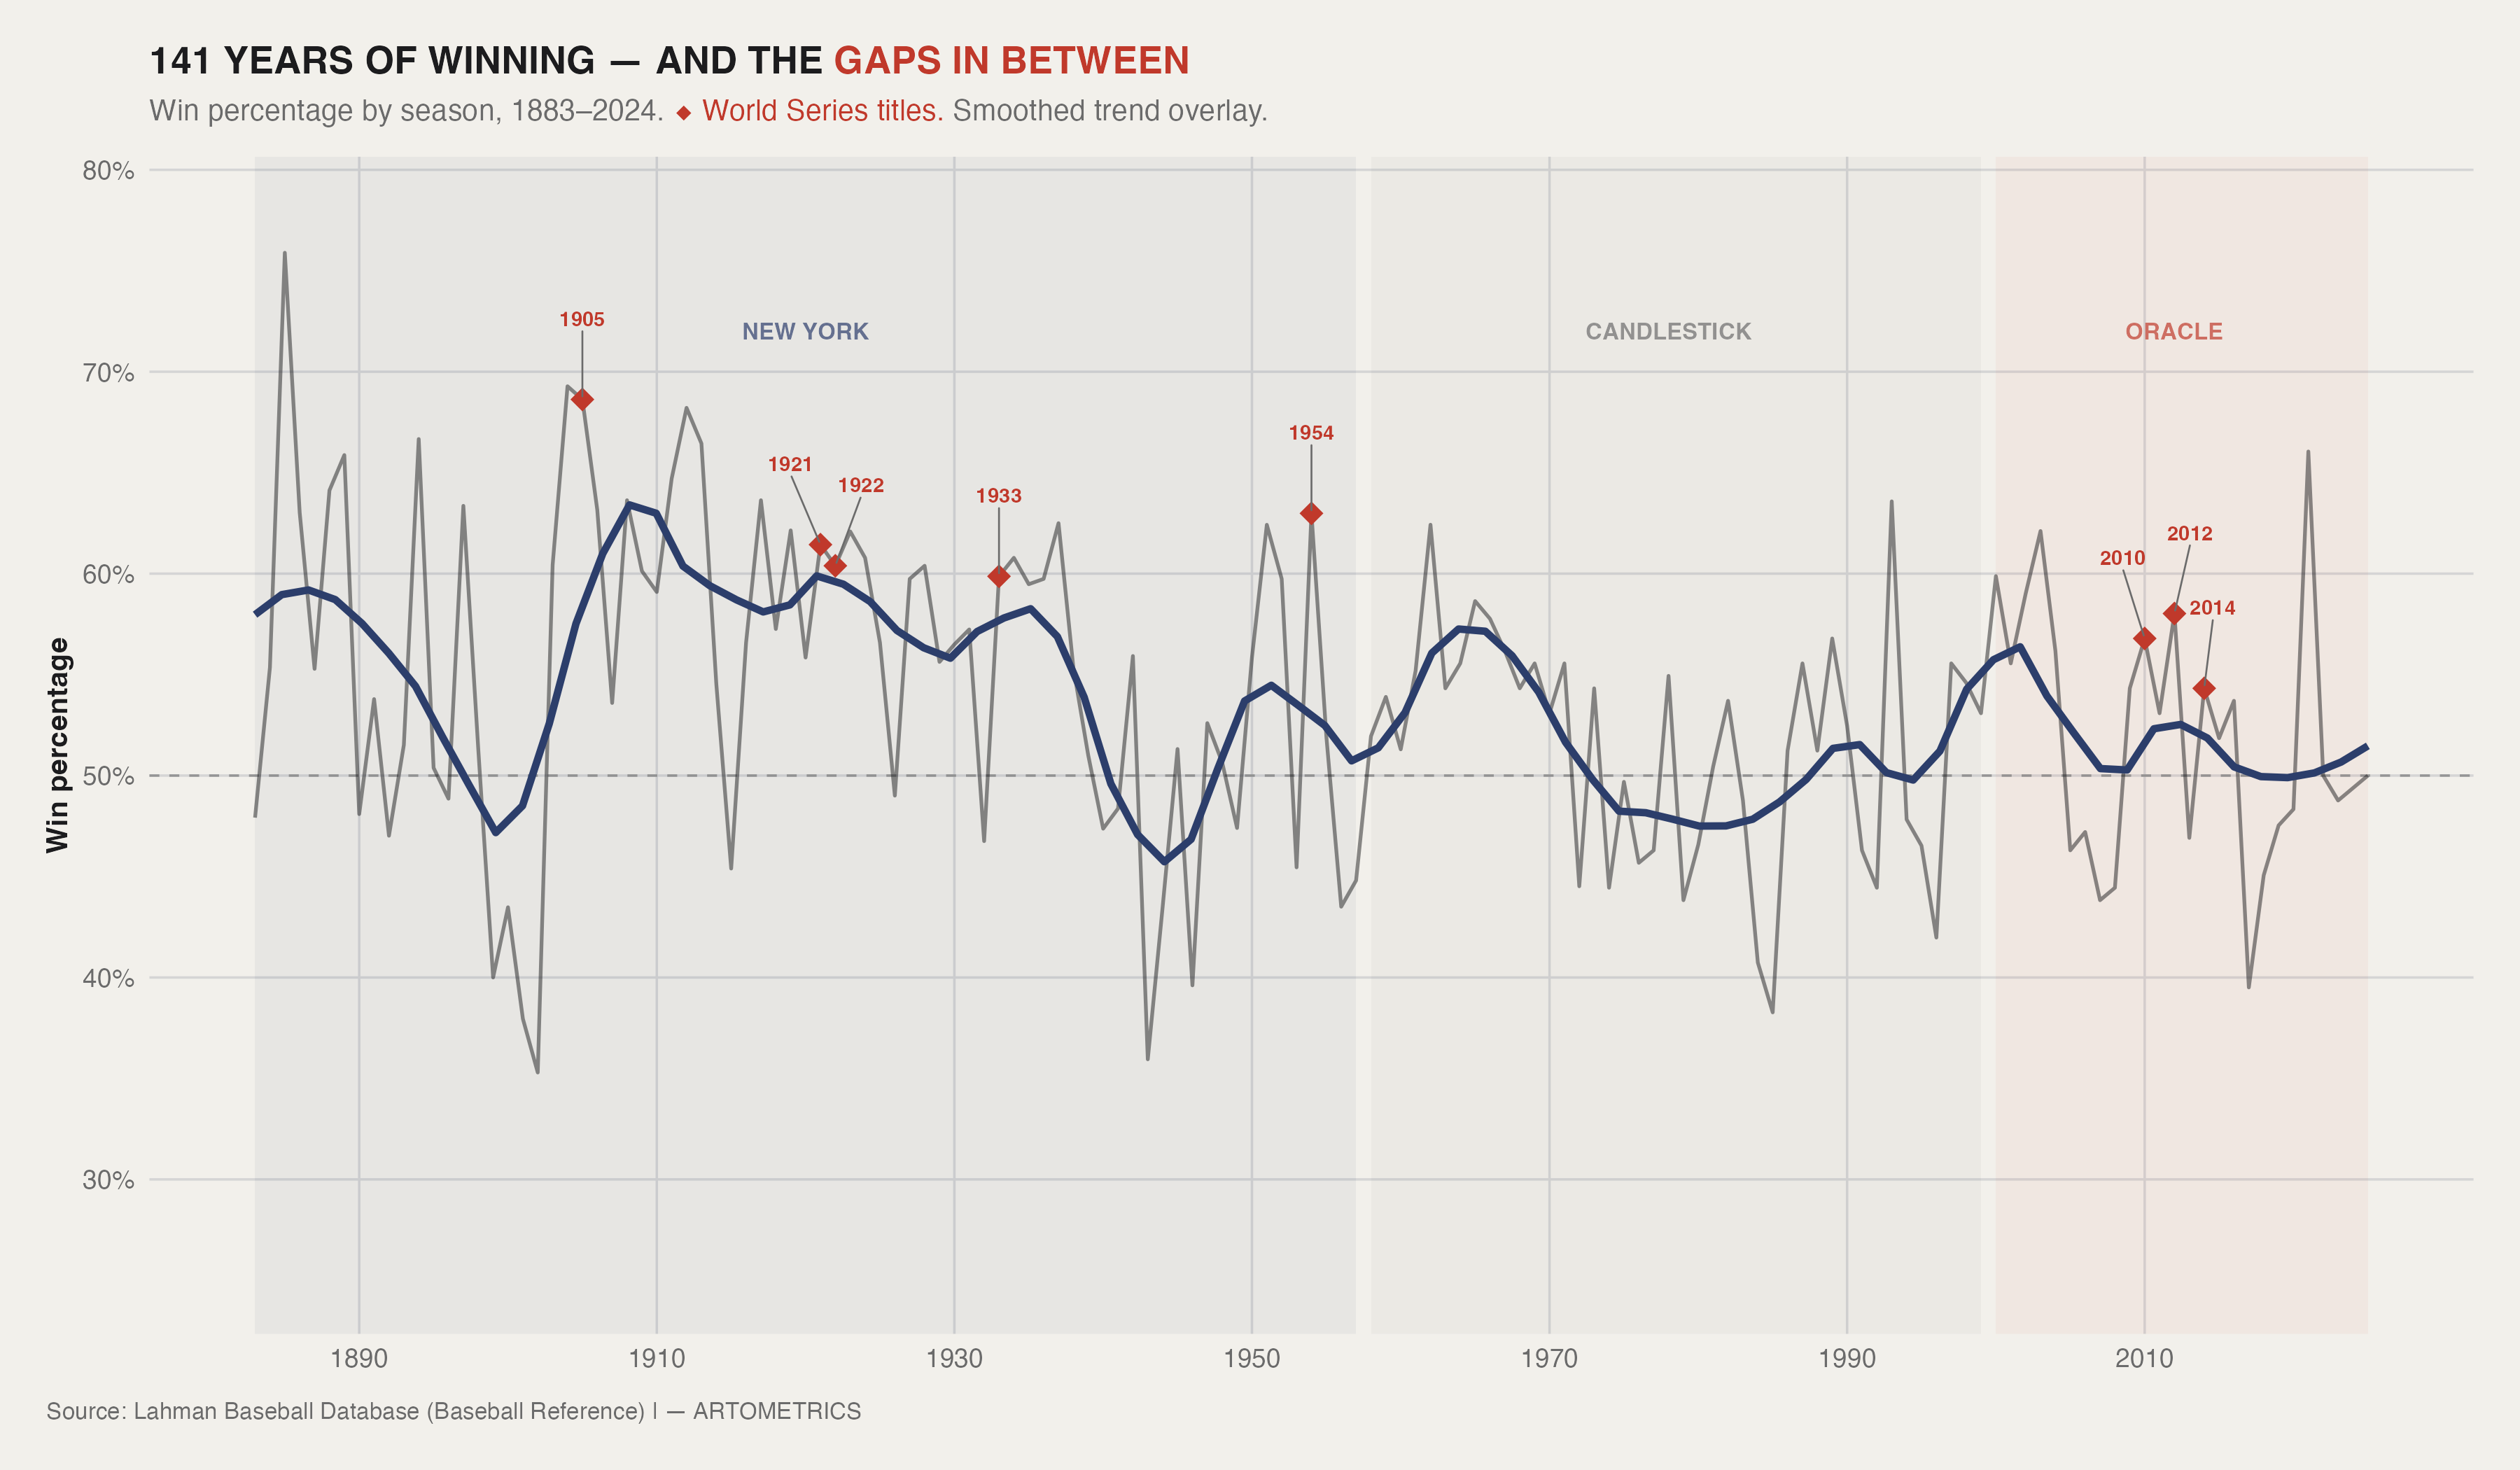
The New York Giants were one of the best franchises in baseball for the first half of the twentieth century. The smoothed trend line sits comfortably above .500 from the 1890s through 1957, with five World Series titles and multiple sustained winning runs under managers John McGraw and Bill Terry. McGraw's Giants in particular — 1903 through 1932 — represent one of the longest managerial dynasties in the sport's history. The franchise didn't just win occasionally. It was the standard against which other franchises measured themselves.
The move to San Francisco in 1958 broke that momentum and didn't fully restore it for fifty years. The Candlestick era produced one pennant in 1962 — a seven-game World Series loss to the Yankees — and another in 1989, which ended with the Loma Prieta earthquake interrupting Game 3 and the A's completing a sweep. The trend line during this period flatlines just below .500, punctuated by individual competitive seasons that never cohered into a sustained run. Willie Mays, Willie McCovey, and Juan Marichal were Hall of Fame talents in a franchise that couldn't build a championship around them. The 1978 season hit a low of .383 — the worst in franchise history since the Dead Ball era.
The Oracle era is the sharpest structural break on the chart. From 2000 onward the raw line is more volatile — more highs and more lows — but the smoothed trend climbs steadily into the 2010–2014 window before receding after 2016. What the trend line can't show is what drove that climb: a front office that developed its own pitching, built around a generational catcher in Buster Posey, and won three championships in five years with a roster that looked nothing like what most people expected a dynasty to look like. The line's descent after 2016 — dipping toward .400 in recent seasons — marks the current rebuild under Farhan Zaidi, a reset that the data shows but the story isn't finished telling yet.
p1 <- ggplot(win_pct_df, aes(x = yearID, y = win_pct)) +
  annotate("rect", xmin = 1883, xmax = 1957,
           ymin = -Inf, ymax = Inf,
           fill = art_secondary, alpha = 0.06) +
  annotate("rect", xmin = 1958, xmax = 1999,
           ymin = -Inf, ymax = Inf,
           fill = art_mid, alpha = 0.05) +
  annotate("rect", xmin = 2000, xmax = max(win_pct_df$yearID),
           ymin = -Inf, ymax = Inf,
           fill = art_highlight, alpha = 0.05) +
  annotate("text", x = 1920, y = 0.72, label = "NEW YORK",
           color = art_secondary, size = 2.8,
           fontface = "bold", alpha = 0.7) +
  annotate("text", x = 1978, y = 0.72, label = "CANDLESTICK",
           color = art_mid, size = 2.8,
           fontface = "bold", alpha = 0.7) +
  annotate("text", x = 2012, y = 0.72, label = "ORACLE",
           color = art_highlight, size = 2.8,
           fontface = "bold", alpha = 0.7) +
  geom_hline(yintercept = 0.5, linetype = "dashed",
             color = art_mid, linewidth = 0.4, alpha = 0.6) +
  geom_line(color = art_dark, linewidth = 0.6, alpha = 0.5) +
  geom_smooth(method = "loess", span = 0.15, se = FALSE,
              color = art_secondary, linewidth = 1.2) +
  geom_point(data = ws_years,
             aes(x = yearID, y = win_pct),
             color = art_highlight, size = 3.5, shape = 18) +
  ggrepel::geom_text_repel(
    data = ws_years,
    aes(x = yearID, y = win_pct, label = yearID),
    color = art_highlight, size = 2.5, fontface = "bold",
    nudge_y = 0.04, direction = "x",
    segment.size = 0.3, segment.color = art_mid,
    max.overlaps = Inf
  ) +
  scale_y_continuous(labels = percent_format(accuracy = 1),
                     limits = c(0.25, 0.78)) +
  scale_x_continuous(breaks = seq(1890, 2020, by = 20)) +
  theme_artometrics() +
  labs(
    title    = "141 YEARS OF WINNING — AND THE GAPS IN BETWEEN",
    subtitle = "Win percentage by season, 1883–2024. ◆ World Series titles. Smoothed trend overlay.",
    x = NULL, y = "Win percentage",
    caption = "Source: Lahman Baseball Database (Baseball Reference) | — ARTOMETRICS"
  )

ggsave("chart1_win_pct.png", plot = p1, path = "charts",
       width = 12, height = 7, dpi = 300, bg = "white")
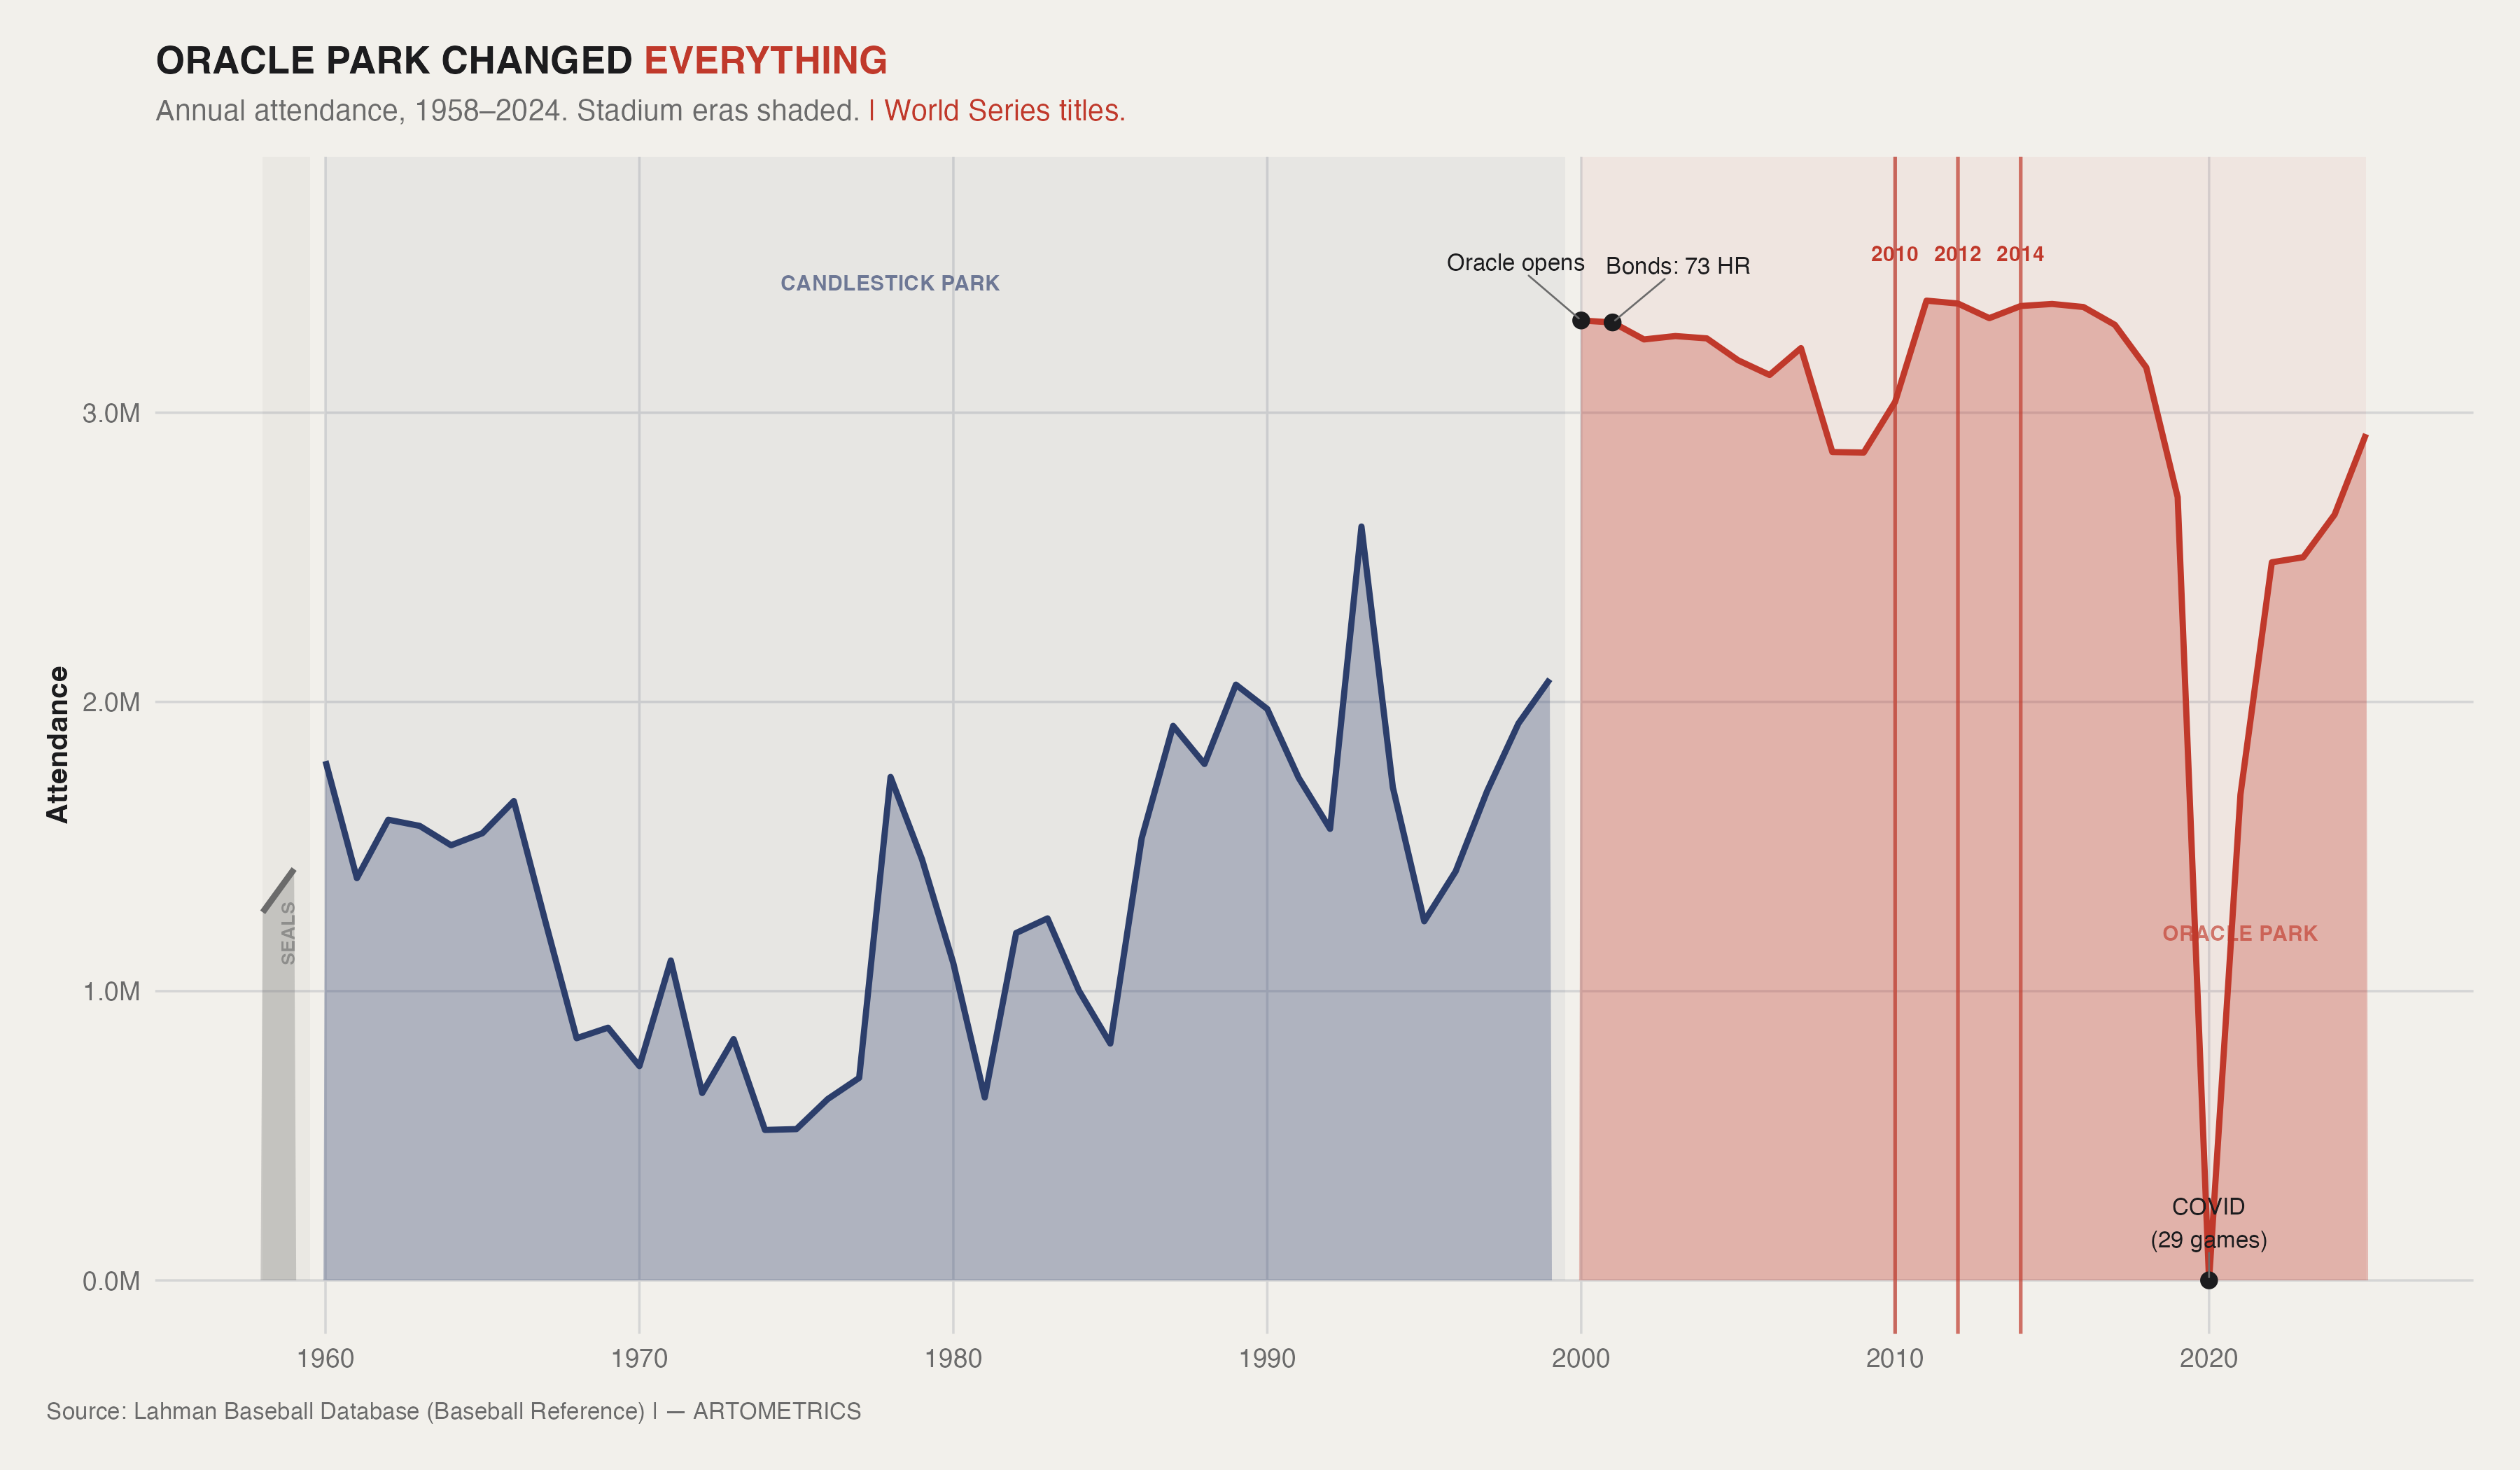
Candlestick Park was bad in ways that are hard to fully communicate to anyone who didn't sit through a night game there. The wind came off the Bay hard enough to knock over cups of coffee. Vin Scully called it the worst ballpark in baseball. Attendance reflected the experience: in the 1970s the Giants drew fewer than 700,000 fans in multiple seasons, running the worst figures of any franchise in the National League. Even in competitive years the stadium suppressed turnout. The 1989 pennant-winning team — one of the most talented in franchise history — drew 2.1 million, a number that Oracle routinely exceeded in rebuilding years.
Oracle Park opened on April 11, 2000, and drew 3.3 million fans in its first season. That single-season jump — from 2.1 million in Candlestick's final year to 3.3 million in Oracle's first — is the most important financial event in franchise history, and it didn't require a winning team to produce it. The ballpark itself was the draw: a privately financed stadium on the waterfront, with views of McCovey Cove and a design that felt like a European soccer ground transplanted to a California setting. The Giants were the first team since the Dodgers in 1962 to build a stadium without public financing, which meant they owned the revenue streams entirely.
What the chart shows from 2000 onward is a floor that Candlestick could never establish. Oracle attendance dipped during the post-Bonds transition years (2007–2009), touching 2.8 million at its lowest — still 700,000 above Candlestick's competitive peaks. The dynasty years pushed it back above 3.3 million and held it there through three consecutive championships. COVID produced the only real interruption since opening day. The recovery to nearly 3.0 million by 2024 confirms what the data suggests throughout: Oracle Park sells itself, even when the team on the field doesn't.
era_fill_colors <- c(
  "Seals Stadium"    = art_mid,
  "Candlestick Park" = art_secondary,
  "Oracle Park"      = art_highlight
)

p2 <- ggplot(attendance_df, aes(x = yearID, y = attendance)) +
  annotate("rect", xmin = 1958, xmax = 1959.5,
           ymin = 0, ymax = Inf, fill = art_mid, alpha = 0.06) +
  annotate("rect", xmin = 1960, xmax = 1999.5,
           ymin = 0, ymax = Inf, fill = art_secondary, alpha = 0.06) +
  annotate("rect", xmin = 2000, xmax = max(attendance_df$yearID),
           ymin = 0, ymax = Inf, fill = art_highlight, alpha = 0.06) +
  geom_vline(data = ws_lines, aes(xintercept = yearID),
             color = art_highlight, linewidth = 0.6,
             linetype = "solid", alpha = 0.7) +
  annotate("text", x = c(2010, 2012, 2014), y = 3.55e6,
           label = c("2010", "2012", "2014"),
           color = art_highlight, size = 2.6, fontface = "bold") +
  geom_area(aes(fill = stadium_era), alpha = 0.3) +
  geom_line(aes(color = stadium_era), linewidth = 1.0) +
  scale_fill_manual(values = era_fill_colors, guide = "none") +
  scale_color_manual(values = era_fill_colors, guide = "none") +
  geom_point(data = label_df, color = art_dark, size = 2.2) +
  ggrepel::geom_text_repel(
    data = label_df, aes(label = label),
    size = 2.8, color = art_dark,
    nudge_x = c(-1.5, 1.5, 0), nudge_y = 2e5,
    segment.color = art_mid, segment.size = 0.3,
    max.overlaps = Inf
  ) +
  annotate("text", x = 1958.8, y = 1.2e6, label = "SEALS",
           color = art_mid, size = 2.3, fontface = "bold",
           angle = 90, alpha = 0.6) +
  annotate("text", x = 1978, y = 3.45e6,
           label = "CANDLESTICK PARK", color = art_secondary,
           size = 2.6, fontface = "bold", alpha = 0.65) +
  annotate("text", x = 2021, y = 1.2e6,
           label = "ORACLE PARK", color = art_highlight,
           size = 2.6, fontface = "bold", alpha = 0.65) +
  scale_y_continuous(
    labels = label_number(scale = 1e-6, suffix = "M", accuracy = 0.1),
    limits = c(0, 3.7e6)
  ) +
  scale_x_continuous(breaks = seq(1960, 2020, by = 10)) +
  theme_artometrics() +
  labs(
    title    = "ORACLE PARK CHANGED EVERYTHING",
    subtitle = "Annual attendance, 1958–2024. Stadium eras shaded. | World Series titles.",
    x = NULL, y = "Attendance",
    caption = "Source: Lahman Baseball Database (Baseball Reference) | — ARTOMETRICS"
  )

ggsave("chart2_attendance.png", plot = p2, path = "charts",
       width = 12, height = 7, dpi = 300, bg = "white")
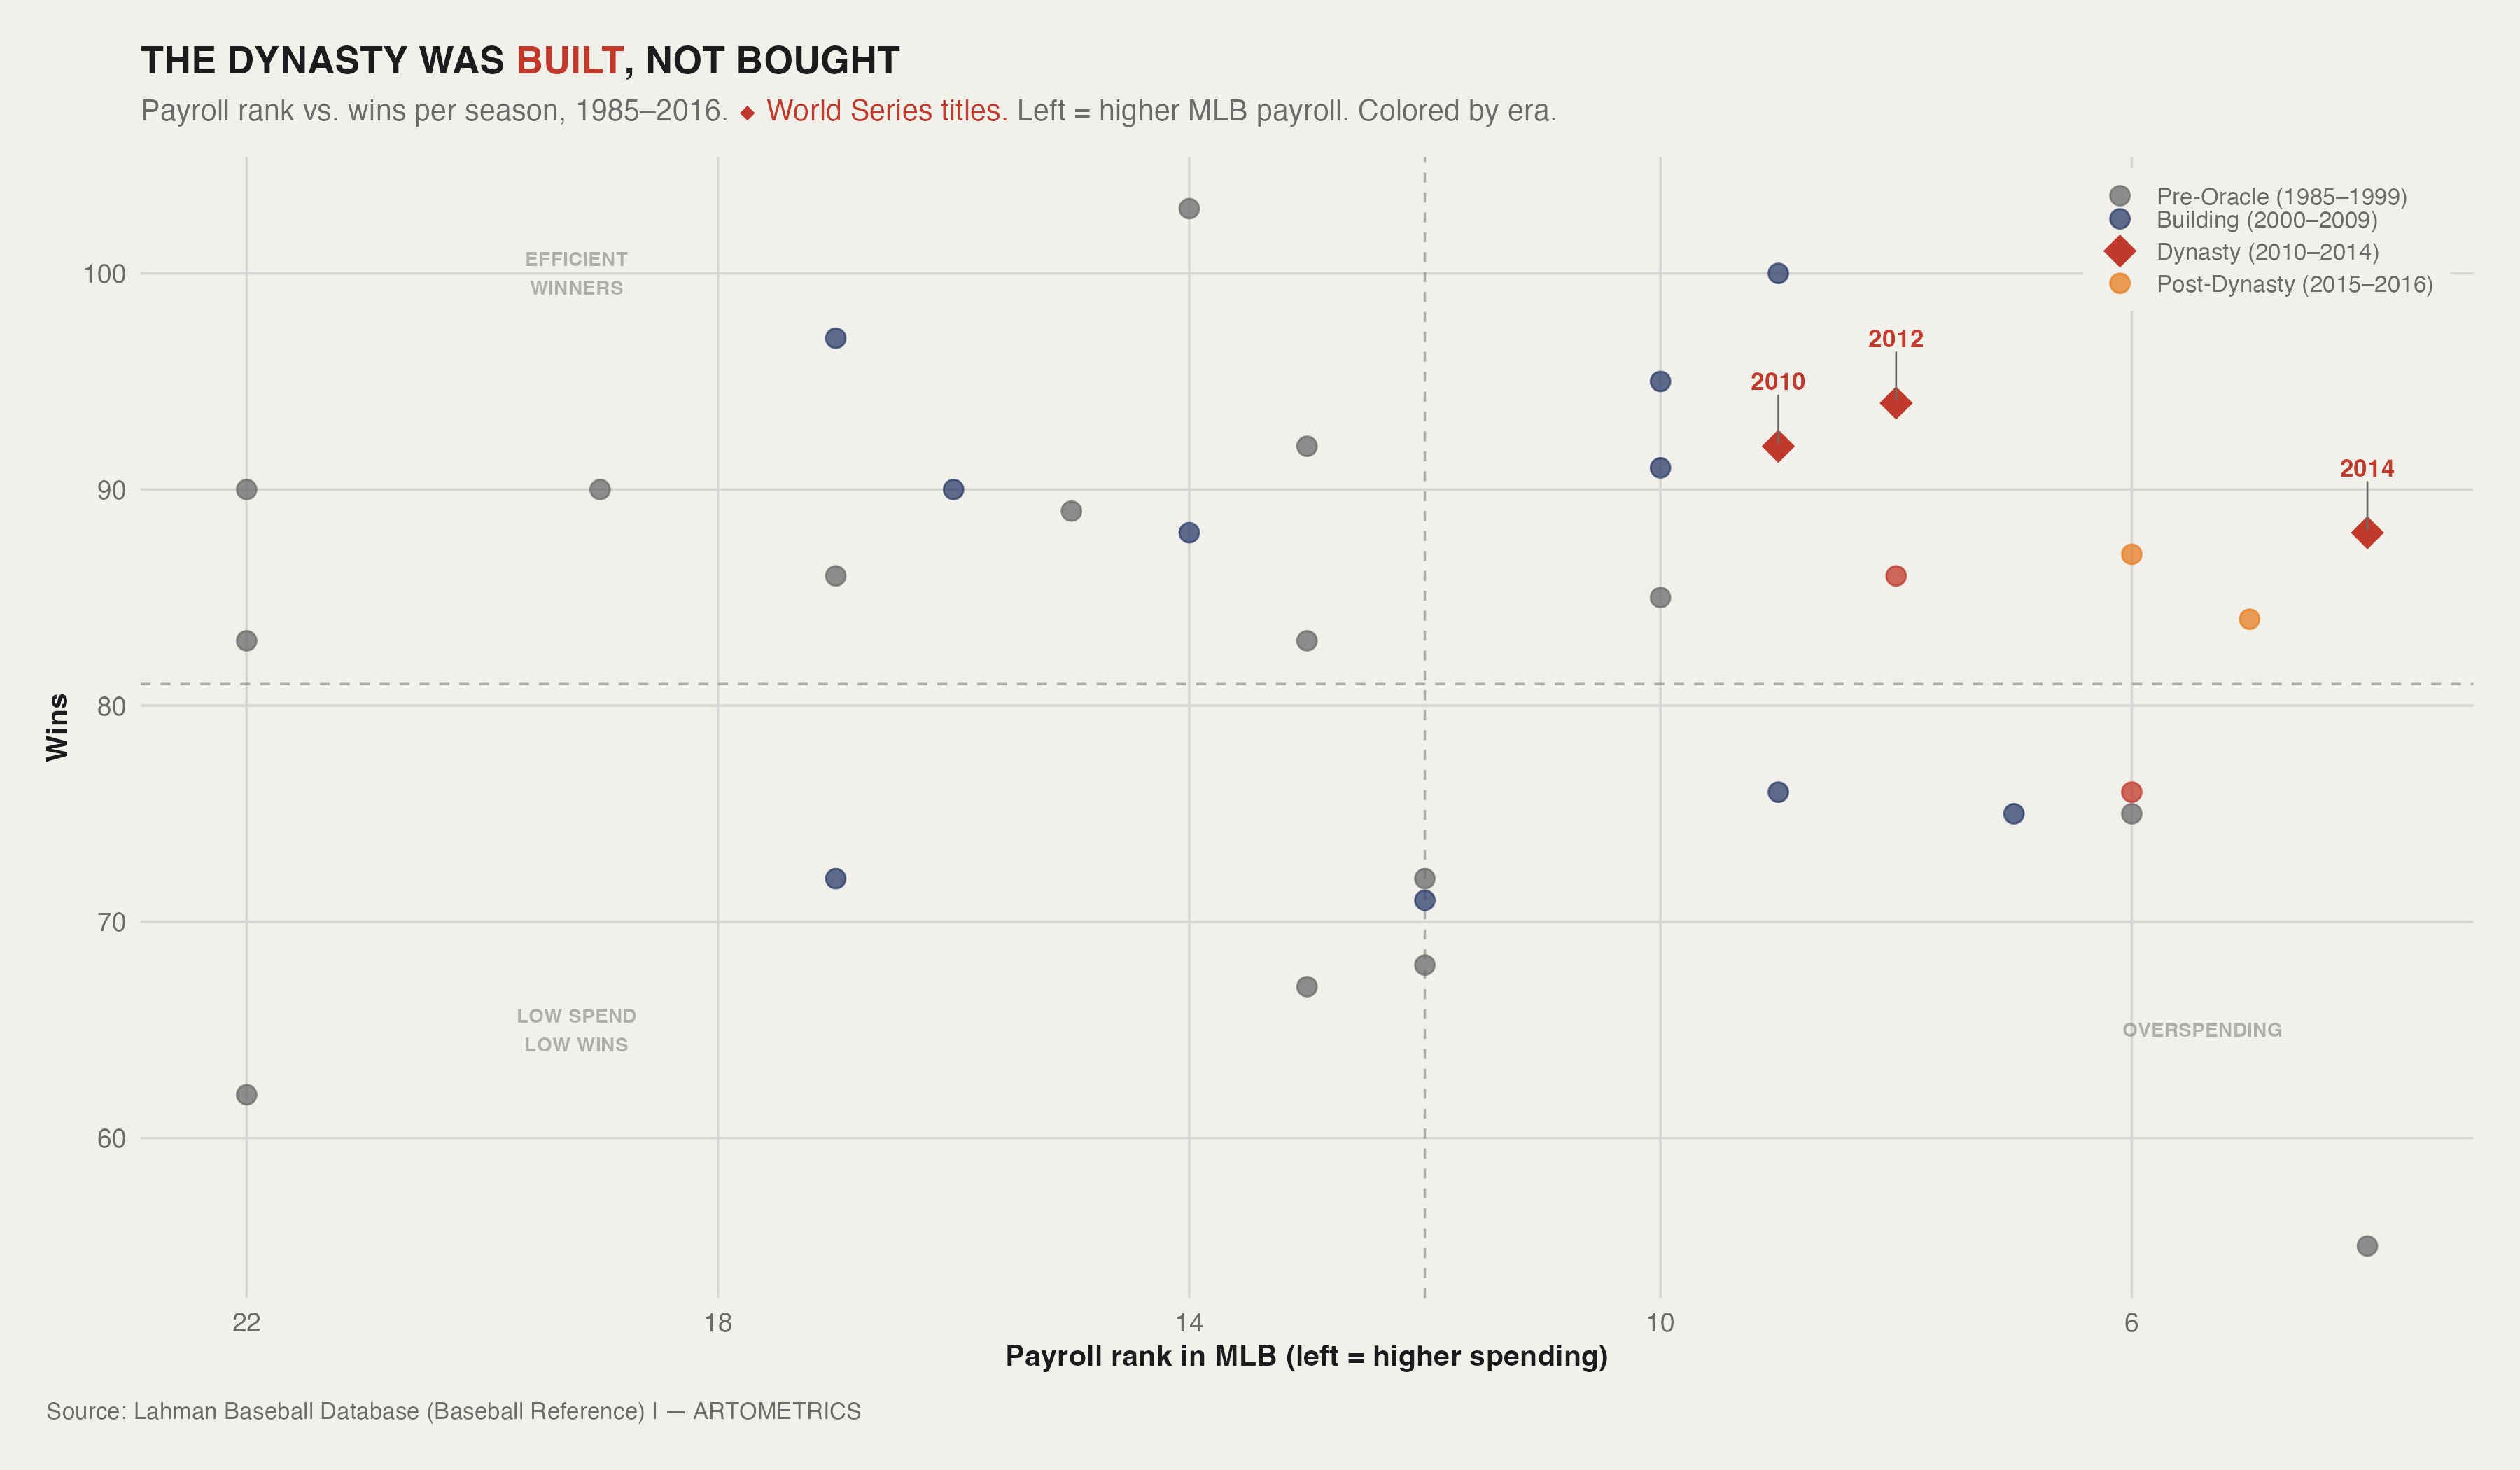
The scatter plot covers 32 seasons of Giants payroll history, and the first thing it tells you is that money and wins have never had a clean relationship in San Francisco. The gray dots — the pre-Oracle years — are scattered across the left half of the chart, representing a team that spent in the middle of the league and got inconsistent results. The 1994 season sits near payroll rank 4 with 55 wins in a strike-shortened year. Barry Bonds arrived in 1993 on the largest free agent contract in baseball history at the time. The spending was real. The championships weren't.
The dynasty window is the cluster of red diamonds in the right-center of the chart. In 2010, the Giants ranked ninth in MLB payroll and won 92 games and a World Series. In 2012, they ranked eighth and won 94. The 2014 title is the standout data point: payroll rank 4 — a genuine top-5 spender — with 88 wins in a season they won through the Wild Card and four survival series. What connects all three is not the spending level but what the money bought. Tim Lincecum, Matt Cain, Madison Bumgarner, and Buster Posey were all drafted by San Francisco. They arrived cheap and performed at an elite level before their arbitration clocks reset the cost. The payroll rank rose as those players got paid for what they had already done, not for what they were expected to do.
By 2015 and 2016 the orange dots appear — post-dynasty, top-5 payroll, 75 to 87 wins. The pipeline that produced Lincecum and Posey had stopped delivering at the same rate, and the organization was paying full market price for players who couldn't replace what the draft had built. It is a pattern that repeats across every dynasty in the sport: the window opens when developed players are still cheap, and closes when they get paid. The Giants rode that window for five years and won three times. Most franchises never ride it once.
era_colors <- c(
  "Pre-Oracle (1985–1999)"   = art_mid,
  "Building (2000–2009)"     = art_secondary,
  "Dynasty (2010–2014)"      = art_highlight,
  "Post-Dynasty (2015–2016)" = "#E67E22"
)

mid_rank <- median(giants_payroll$payroll_rank, na.rm = TRUE)

p3 <- ggplot(giants_payroll, aes(x = payroll_rank, y = W)) +
  geom_vline(xintercept = mid_rank, linetype = "dashed",
             color = art_mid, linewidth = 0.4, alpha = 0.5) +
  geom_hline(yintercept = 81, linetype = "dashed",
             color = art_mid, linewidth = 0.4, alpha = 0.5) +
  annotate("text", x = mid_rank * 0.45, y = 100,
           label = "HIGH SPEND\nHIGH WINS", color = art_mid,
           size = 2.4, fontface = "bold", alpha = 0.5) +
  annotate("text", x = mid_rank * 1.6, y = 100,
           label = "EFFICIENT\nWINNERS", color = art_mid,
           size = 2.4, fontface = "bold", alpha = 0.5) +
  annotate("text", x = mid_rank * 0.45, y = 65,
           label = "OVERSPENDING", color = art_mid,
           size = 2.4, fontface = "bold", alpha = 0.5) +
  annotate("text", x = mid_rank * 1.6, y = 65,
           label = "LOW SPEND\nLOW WINS", color = art_mid,
           size = 2.4, fontface = "bold", alpha = 0.5) +
  geom_point(data = giants_payroll |> filter(!ws_title),
             aes(color = era), size = 2.8, alpha = 0.75) +
  geom_point(data = giants_payroll |> filter(ws_title),
             aes(color = era), size = 5, shape = 18) +
  ggrepel::geom_text_repel(
    data = giants_payroll |> filter(ws_title),
    aes(label = label, color = era),
    size = 3, fontface = "bold",
    nudge_y = 3, direction = "x",
    segment.size = 0.3, segment.color = art_mid,
    show.legend = FALSE
  ) +
  scale_color_manual(values = era_colors, name = NULL) +
  scale_x_reverse(breaks = seq(2, 26, by = 4)) +
  theme_artometrics() +
  theme(
    legend.position      = c(0.99, 0.99),
    legend.justification = c(1, 1),
    legend.key.size      = unit(0.5, "lines"),
    legend.spacing.y     = unit(0.2, "cm")
  ) +
  labs(
    title    = "THE DYNASTY WAS BUILT, NOT BOUGHT",
    subtitle = "Payroll rank vs. wins per season, 1985–2016. ◆ World Series titles. Left = higher MLB payroll. Colored by era.",
    x       = "Payroll rank in MLB (left = higher spending)",
    y       = "Wins",
    caption = "Source: Lahman Baseball Database (Baseball Reference) | — ARTOMETRICS"
  )

ggsave("chart3_payroll_wins.png", plot = p3, path = "charts",
       width = 12, height = 7, dpi = 300, bg = "white")
The Lahman salary data ends in 2016. Seven seasons of Giants history — including the current rebuild under Farhan Zaidi and the signings of Carlos Correa, the failed pursuit of Aaron Judge, and the transition from Joey Bart to Patrick Bailey — are entirely absent from Chart 3. Any claims about the post-2016 payroll efficiency story require updating against a more current source such as Spotrac or Baseball Reference's payroll pages. The dynasty thesis is well-supported by the data that exists; the post-dynasty decline is directionally indicated by 2015–2016 but not fully documented here.
Total payroll as computed from the Lahman Salaries table may not capture every dollar of team spending. Deferred compensation — a significant factor in modern contracts — is not always reflected in the year it is earned. Minor league contracts, coaching staff salaries, and international signing bonuses are excluded entirely. What the table measures is major league player salaries as reported, which is the standard methodology for this type of analysis and directionally reliable, but should not be read as a precise accounting of total organizational spending.
Win percentage comparisons across 141 seasons carry inherent limitations. Pre-1900 baseball used different rules — pitching distances, foul ball conventions, and schedule lengths all varied — making direct comparisons between the 1890s and the 2010s imprecise. The 1994 and 1995 strike-shortened seasons and the 2020 pandemic season produce outlier values in the raw data that the LOESS smoother partially absorbs but does not eliminate. These seasons are included rather than excluded because removing them would obscure real franchise history; readers should interpret them with the schedule context in mind.
The San Francisco Giants are three franchises in one uniform. The New York Giants were a dynasty — one of the most successful organizations in the first half of baseball history, built around Hall of Fame managers and Hall of Fame players, winning five World Series titles before most of their fans had access to a television. The Candlestick Giants were something harder to categorize: a franchise with generational talent and a stadium that made it nearly impossible to sustain the kind of fan engagement that builds organizational stability. Willie Mays played in San Francisco for fifteen years and never won a championship there. The 2010–2014 Giants are the third franchise — the one that finally broke the Candlestick era's pattern by changing the economic conditions that produced it.
Oracle Park is the foundation that made the dynasty possible, not its product. The stadium opened in 2000, immediately doubled the franchise's attendance floor, and gave the organization a revenue base that could sustain a top-10 payroll without burning ownership patience. When the front office — under general manager Brian Sabean and manager Bruce Bochy — developed Lincecum, Cain, Bumgarner, and Posey through the draft, the payroll structure let them retain those players through their prime years while Oracle revenue funded the supporting cast. The dynasty and the ballpark are not separate stories. They are the same story told from different angles.
The harder question — the one this dataset cannot fully answer — is whether anything like it happens again. The Zaidi era has produced younger talent in Marco Luciano and Kyle Harrison, but nothing yet at the level of Bumgarner or Posey emerging from the system. The payroll remains top-10, the ballpark remains a financial engine, and the organizational infrastructure is intact. What is missing is the draft output that made the dynasty efficient rather than merely expensive. The data says the Giants know how to win without overspending. Whether they can rediscover the player development model that made that possible is the open question heading into the next era of franchise history.
Lahman, S. (2024). Lahman Baseball Database (Version 11.0). Retrieved from seanlahman.com
Friendly, M., Dalzell, C., Monkman, M., & Murphy, D. (2021). Lahman: Sean 'Lahman' Baseball Database (R package version 10.0-1). Retrieved from CRAN.R-project.org
Baseball Reference. (2024). San Francisco Giants franchise history. Sports Reference LLC. Retrieved from baseball-reference.com
James, B. (2001). The New Bill James Historical Baseball Abstract. Free Press.
Schwarz, A. (2004). The Numbers Game: Baseball's Lifelong Fascination with Statistics. Thomas Dunne Books.
Brown, G. (2012). The San Francisco Giants: 50 Years. Arcadia Publishing.
This report was researched, written, designed, and produced in active collaboration with Claude AI (Anthropic). The data pipeline, statistical analysis, chart design, written analysis, narrative structure, and visual styling were all developed through a directed partnership between human editorial judgment and AI execution. The research questions and brand vision are ours. The execution is a collaboration.
— Artometrics Editorial