COFFEE: The Artometrics of Java


Coffee is the world's second-largest traded commodity by value, behind only crude oil. More than 125 million people depend on it for their livelihoods. Around 2.25 billion cups are consumed every day. And yet the country that produces the highest-quality coffee on earth — by a significant margin, according to the Coffee Quality Institute's own grading data — has exactly zero Starbucks locations. That country is Ethiopia.
This report analyzes 1,339 coffee samples rated by the Coffee Quality Institute (CQI) using the Q Grader scoring methodology, alongside Starbucks' global store footprint across 73 countries. The CQI dataset covers 10 sensory sub-metrics — aroma, flavor, aftertaste, acidity, body, balance, uniformity, clean cup, sweetness, and cupper points — aggregated into a 100-point total cup score. Together, these two datasets tell a story about quality, market power, and the gap between where the best coffee grows and where the money flows.
The Coffee Quality Institute is a nonprofit that trains and certifies Q Graders — licensed sensory evaluators who score coffee using a standardized 100-point protocol. A sample must score 80 or above to qualify as "specialty coffee." The CQI dataset made available through TidyTuesday (2020-07-07) contains 1,339 samples spanning Arabica and Robusta species, with individual scores across ten sub-metrics plus a total cup points aggregate. This analysis focuses exclusively on Arabica, which accounts for roughly 60% of global production and uses a different quality rubric than Robusta. After removing one data entry error (a near-zero-score row), the working Arabica dataset contains 1,312 samples from 36 countries.
The Starbucks locations dataset (TidyTuesday 2018-05-07) documents 25,600 individual store locations across 73 countries, with brand, ownership type (company-owned vs. licensed), city, and geographic coordinates. For Chart 2, Starbucks counts were aggregated at the country level and joined to CQI quality scores using ISO-2 country codes. Hawaii is treated as its own origin in the CQI data and is mapped to the US country code for the Starbucks join — the retail overlap is real even if imprecise, since Kona coffee commands premium shelf space in U.S. locations.
The sub-metric fingerprint analysis in Chart 3 covers seven of the ten CQI sub-metrics: aroma, flavor, aftertaste, acidity, body, balance, and cupper points. Uniformity, clean cup, and sweetness were excluded because they function more as defect-penalty fields than sensory attributes — nearly every Arabica sample in the dataset scores at or near the maximum on all three, leaving no meaningful variation to visualize. The top eight countries by sample volume were selected for the heatmap to ensure statistically stable medians.
Country-level analyses were filtered to origins with 20 or more CQI samples to avoid medians driven by one or two unrepresentative submissions. This threshold reduces the country pool from 36 to 16 but substantially improves the reliability of distributional comparisons. All wrangling was performed in R using tidyverse; no imputation was applied to missing values — records with null entries in relevant fields were dropped from the specific chart requiring that field.
-- CQI Arabica samples by country (20+ samples, ranked by median score)
SELECT
  country_of_origin,
  COUNT(*)                                          AS n_samples,
  ROUND(MEDIAN(total_cup_points), 2)                AS median_score,
  ROUND(AVG(total_cup_points), 2)                   AS mean_score,
  ROUND(MIN(total_cup_points), 2)                   AS min_score,
  ROUND(MAX(total_cup_points), 2)                   AS max_score
FROM coffee_ratings
WHERE species = 'Arabica'
  AND total_cup_points > 10
  AND country_of_origin IS NOT NULL
GROUP BY country_of_origin
HAVING COUNT(*) >= 20
ORDER BY median_score DESC;

-- Sub-metric fingerprint: median scores per country and attribute
SELECT
  country_of_origin,
  ROUND(MEDIAN(aroma), 2)         AS med_aroma,
  ROUND(MEDIAN(flavor), 2)        AS med_flavor,
  ROUND(MEDIAN(aftertaste), 2)    AS med_aftertaste,
  ROUND(MEDIAN(acidity), 2)       AS med_acidity,
  ROUND(MEDIAN(body), 2)          AS med_body,
  ROUND(MEDIAN(balance), 2)       AS med_balance,
  ROUND(MEDIAN(cupper_points), 2) AS med_cupper_points
FROM coffee_ratings
WHERE species = 'Arabica'
  AND total_cup_points > 10
  AND country_of_origin IN (
    'Ethiopia','Kenya','Costa Rica','Colombia',
    'Guatemala','Honduras','Mexico','Brazil'
  )
GROUP BY country_of_origin
ORDER BY MEDIAN(total_cup_points) DESC;

-- Starbucks store count by country
SELECT
  Country       AS iso2,
  COUNT(*)      AS sbux_stores
FROM starbucks_locations
WHERE Brand = 'Starbucks'
GROUP BY Country
ORDER BY sbux_stores DESC;
import pandas as pd

# Load CQI data
coffee = pd.read_csv(
    "https://raw.githubusercontent.com/rfordatascience/tidytuesday/"
    "main/data/2020/2020-07-07/coffee_ratings.csv"
)

# Filter to Arabica, remove data entry error
arabica = coffee[
    (coffee["species"] == "Arabica") &
    (coffee["total_cup_points"] > 10)
].copy()

# Country summary: median score, 20+ samples only
country_summary = (
    arabica
    .dropna(subset=["country_of_origin"])
    .groupby("country_of_origin")
    .filter(lambda x: len(x) >= 20)
    .groupby("country_of_origin")
    .agg(
        n_samples=("total_cup_points", "count"),
        median_score=("total_cup_points", "median"),
        mean_score=("total_cup_points", "mean"),
    )
    .round(2)
    .sort_values("median_score", ascending=False)
)
print(country_summary)

# Sub-metric fingerprint for top 8 countries
sub_metrics = ["aroma", "flavor", "aftertaste", "acidity",
               "body", "balance", "cupper_points"]
top_8 = [
    "Ethiopia", "Kenya", "Costa Rica", "Colombia",
    "Guatemala", "Honduras", "Mexico", "Brazil"
]

fingerprint = (
    arabica[arabica["country_of_origin"].isin(top_8)]
    [["country_of_origin"] + sub_metrics]
    .groupby("country_of_origin")
    .median()
    .round(2)
    .loc[top_8]
)
print(fingerprint)
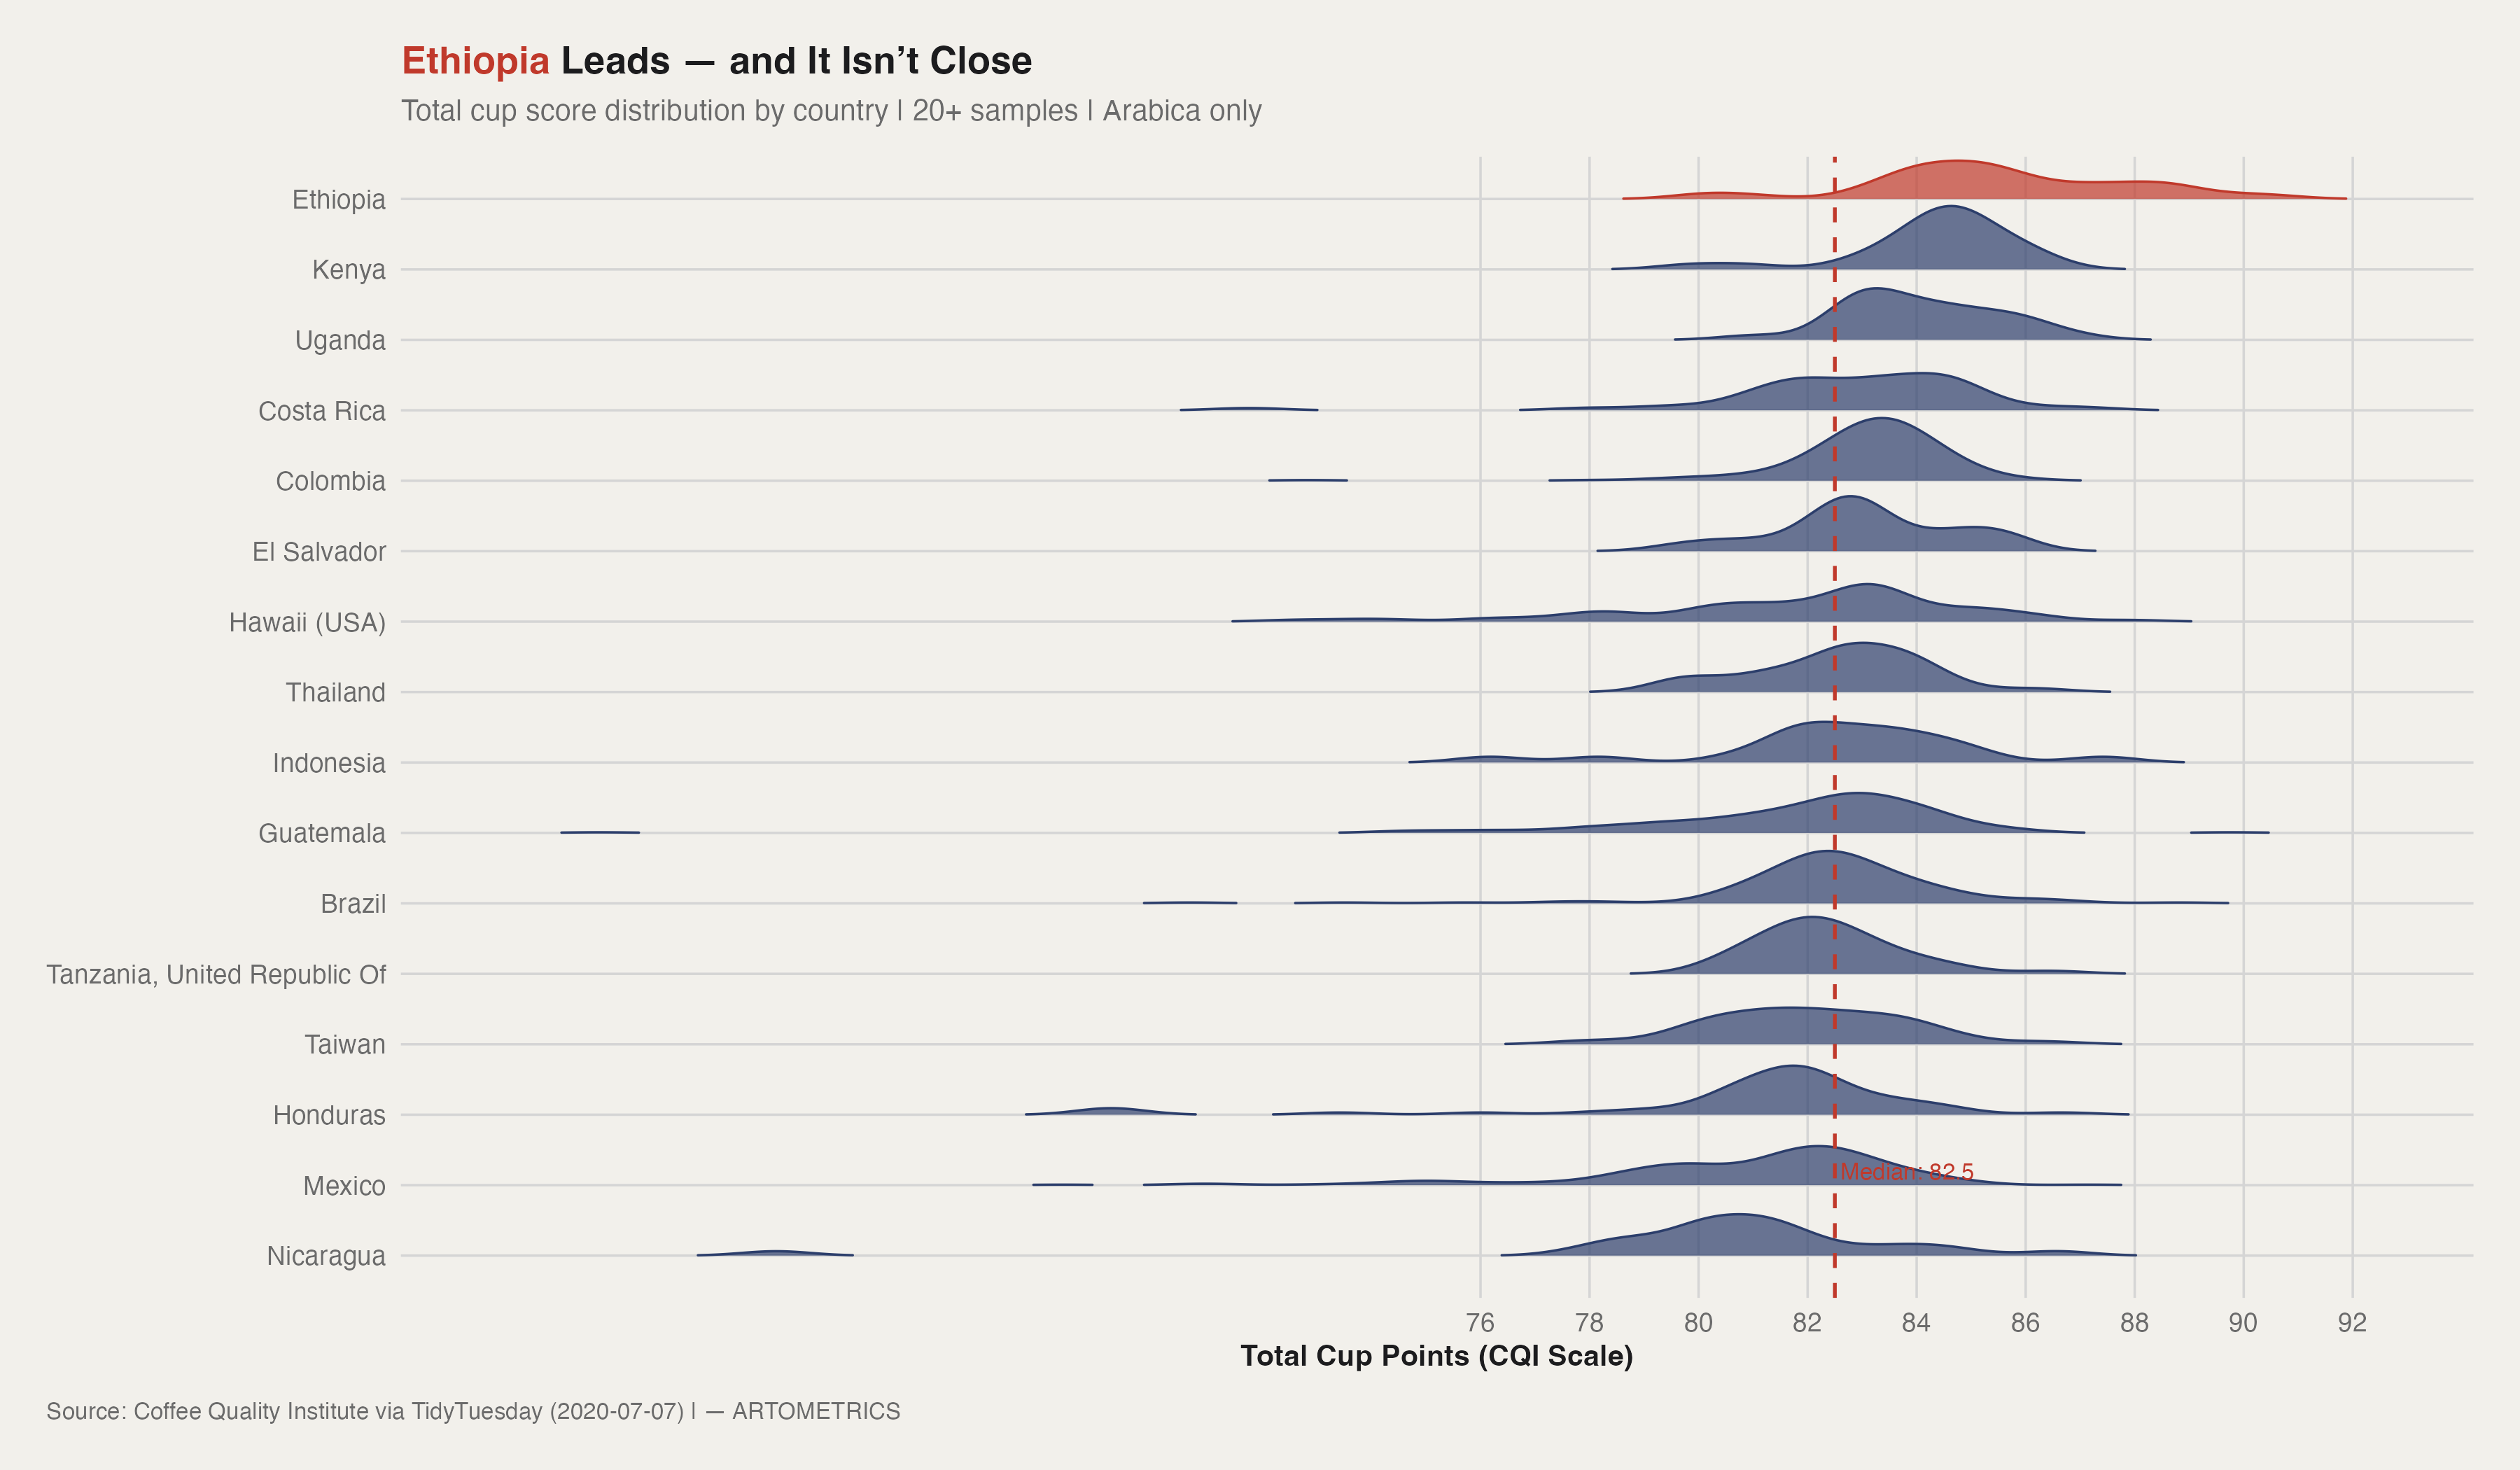
Ethiopia doesn't just lead — it occupies a different part of the distribution entirely. While the median cup score across all 16 qualifying countries sits at 82.5, Ethiopia's distribution peaks near 85 and has a long right tail that no other origin comes close to matching. Kenya and Uganda sit in second and third, but their distributions overlap substantially with the rest of the field. Ethiopia's does not.
What makes this finding significant is what it implies about terroir and altitude. Ethiopia is the genetic origin of Arabica coffee — the Kaffa region in southwestern Ethiopia is where the species was first documented growing wild. The country's range of elevation, soil diversity, and processing tradition produces a flavor complexity that Q Graders consistently reward with above-median scores across every sub-metric. This isn't brand perception. It's sensory evaluation by licensed professionals using a standardized protocol.
The bottom of the chart is equally instructive. Nicaragua, Mexico, Honduras, and Taiwan all cluster between 81 and 83 — technically specialty grade, but right at the floor. Hawaii (USA) shows the widest distribution of any origin on the chart, reflecting the heterogeneity of Kona and Ka'u growing regions alongside lower-grade output caught in the same CQI sample pool. Brazil, the world's largest coffee producer by volume, lands firmly in the lower half — a reminder that market dominance and cup quality are not the same thing.
p1 <- ggplot(
  coffee_countries,
  aes(x     = total_cup_points,
      y     = country_of_origin,
      fill  = is_ethiopia,
      color = is_ethiopia)
) +
  geom_density_ridges(
    alpha          = 0.7,
    scale          = 0.9,
    linewidth      = 0.4,
    rel_min_height = 0.005
  ) +
  geom_vline(
    xintercept = overall_median,
    color      = art_highlight,
    linetype   = "dashed",
    linewidth  = 0.6
  ) +
  annotate(
    "text",
    x     = overall_median + 0.1,
    y     = 2.2,
    label = paste0("Median: ", round(overall_median, 1)),
    color = art_highlight,
    size  = 2.8,
    hjust = 0
  ) +
  scale_fill_manual(values  = c("FALSE" = art_secondary, "TRUE" = art_highlight)) +
  scale_color_manual(values = c("FALSE" = art_secondary, "TRUE" = art_highlight)) +
  scale_x_continuous(breaks = seq(76, 92, 2)) +
  labs(
    title    = "Ethiopia Leads — and It Isn't Close",
    subtitle = "Total cup score distribution by country | 20+ samples | Arabica only",
    x        = "Total Cup Points (CQI Scale)",
    y        = NULL,
    caption  = "Source: Coffee Quality Institute via TidyTuesday (2020-07-07) | — ARTOMETRICS"
  ) +
  theme_artometrics() +
  theme(legend.position = "none")

ggsave("chart1_country_ridgeline.png", p1,
       path = "charts", width = 12, height = 7, dpi = 300, bg = "white")
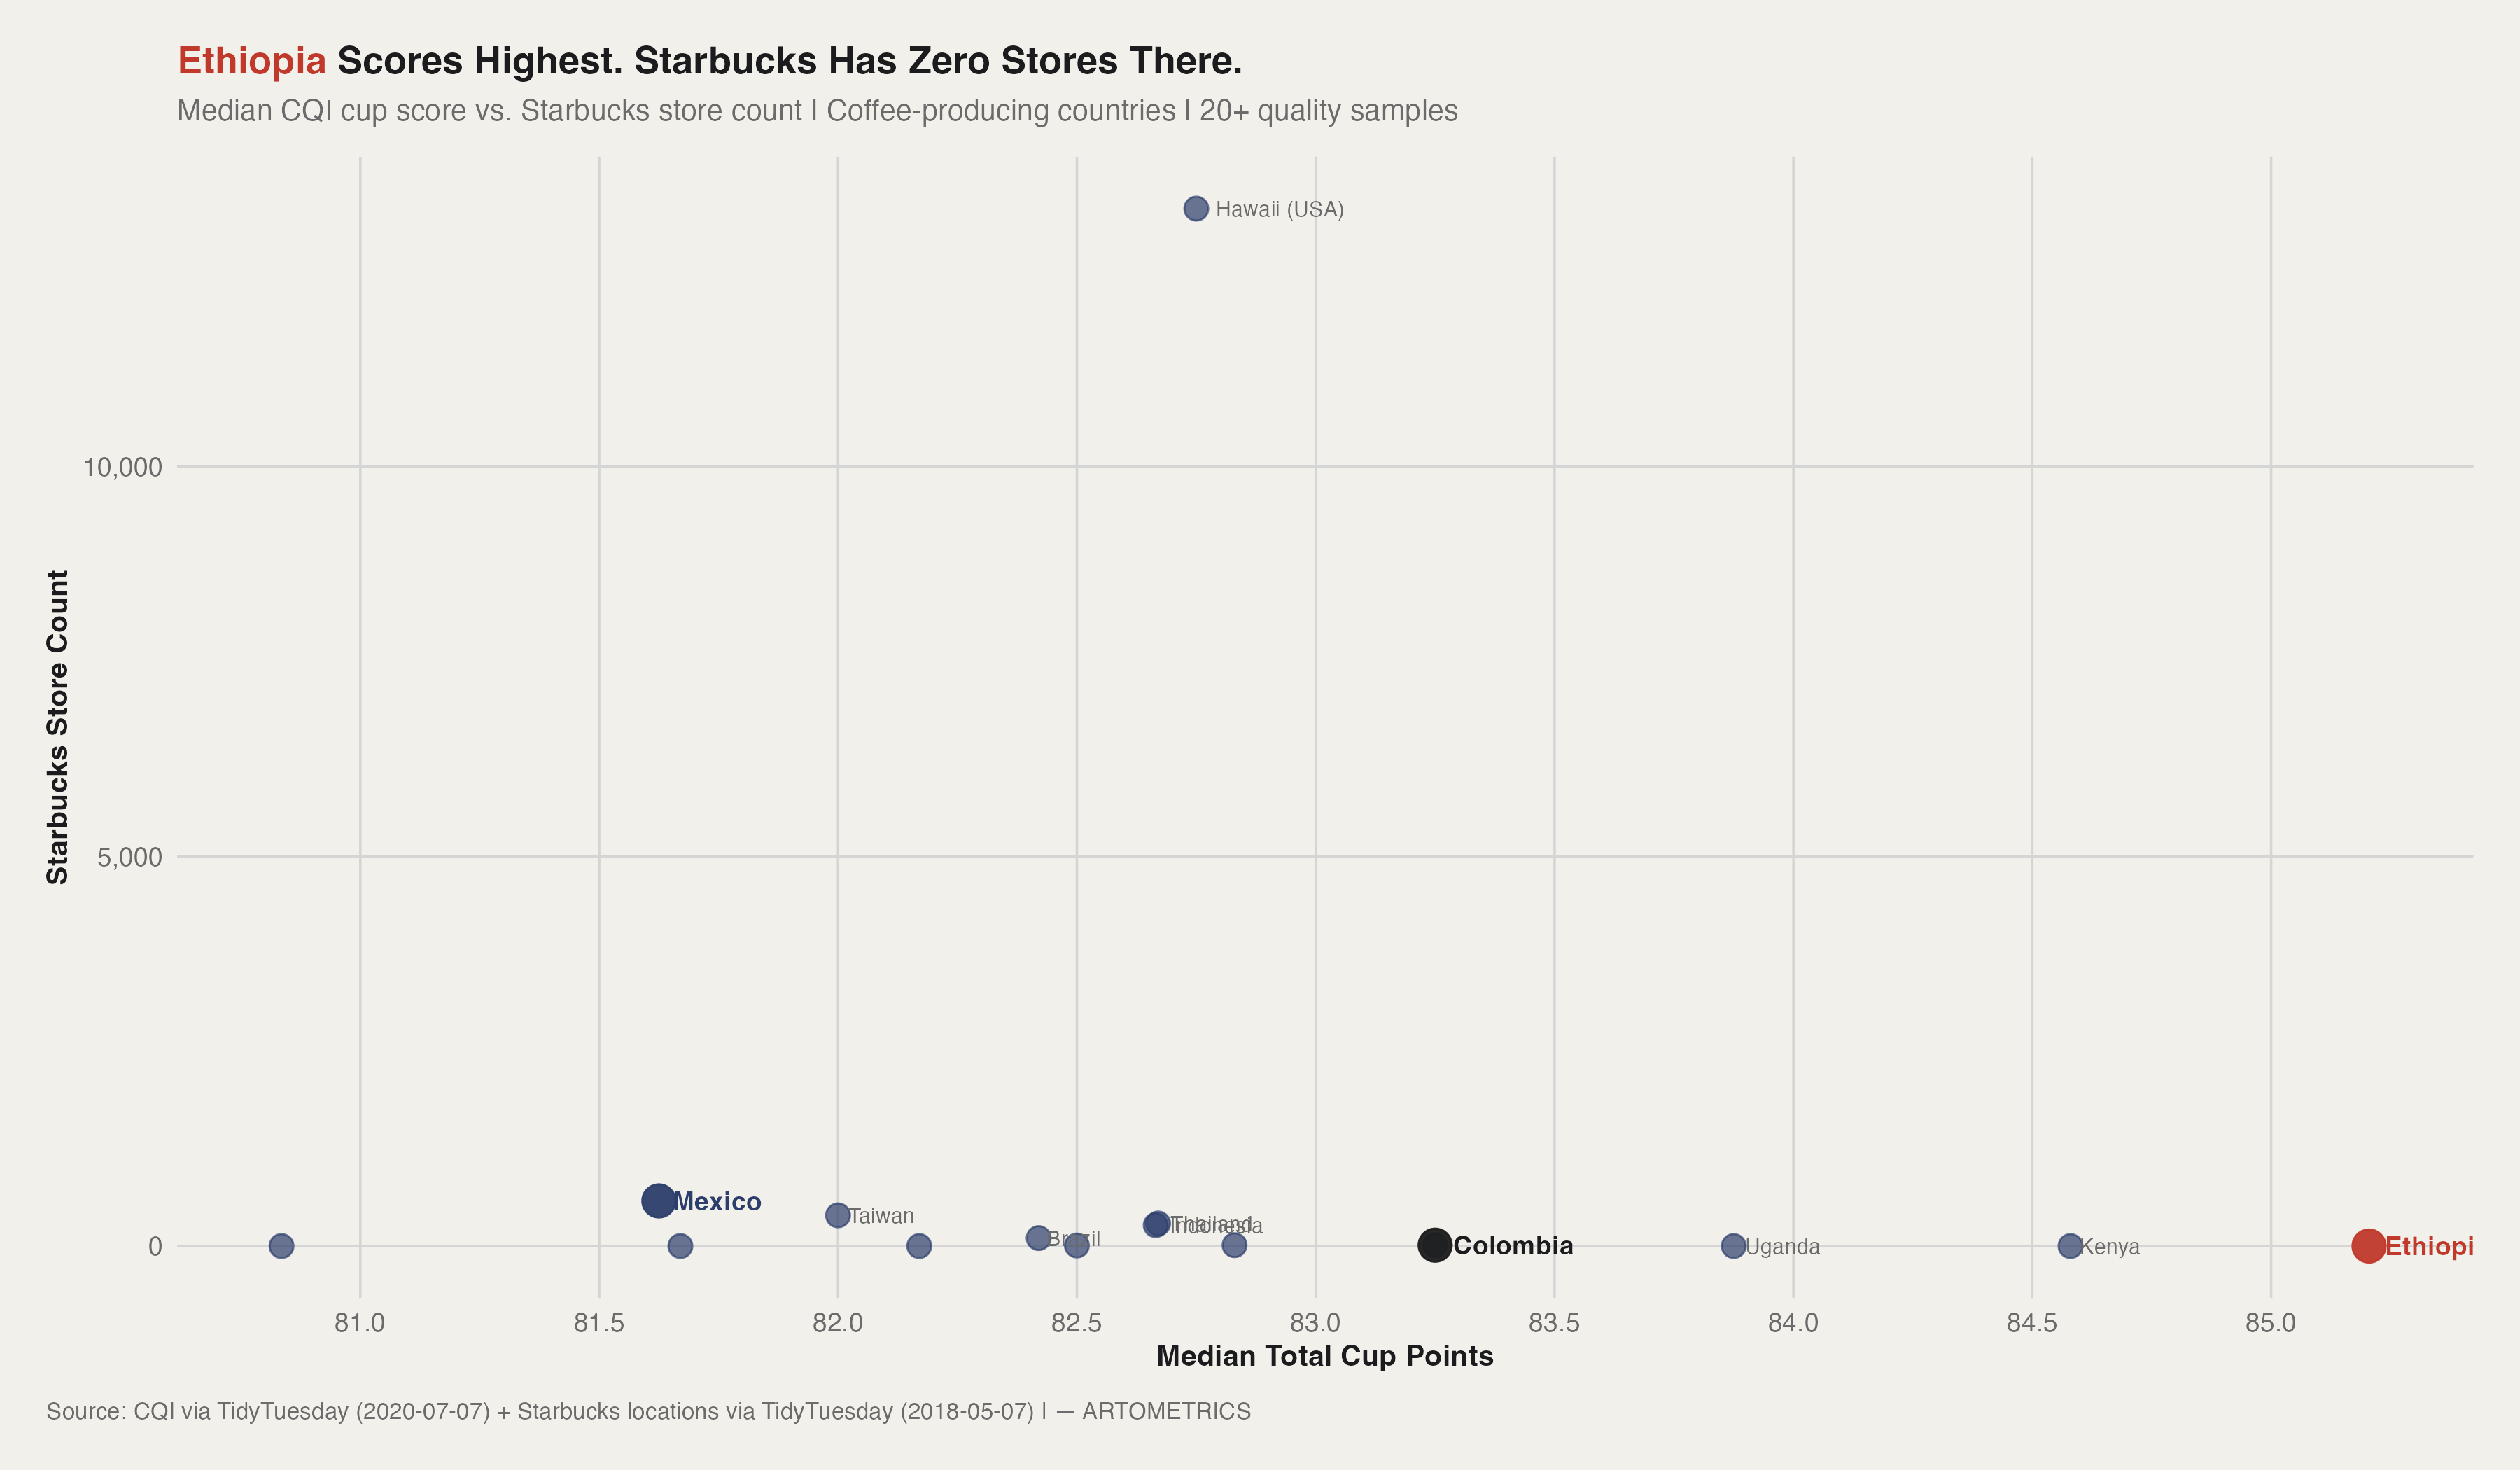
There is no positive relationship between a country's quality score and Starbucks' retail presence there. If anything, the chart tells the opposite story. The three highest-scoring origins — Ethiopia, Kenya, and Uganda — all sit at zero Starbucks locations. Meanwhile, Hawaii (USA) lands near the top of the y-axis not because of its quality rank but because its ISO code maps to the US, which hosts thousands of Starbucks locations. Mexico and Colombia occupy the middle of the quality range and have meaningful retail footprints. The best coffee in the world is effectively invisible to the world's largest coffee retailer's store network.
This is not accidental — it is structural. Starbucks builds stores in markets where it can sell coffee, not in markets where it sources coffee. Ethiopia's retail consumer market is too small and too low-income to support the Starbucks price point. The company sources Ethiopian beans — its Ethiopia single-origin offerings appear in Reserve stores and seasonal rotations — but that sourcing relationship doesn't translate into a domestic retail presence. The supply chain runs one direction.
The Colombia data point reinforces it. Colombia scores a median 82.5 and sits right at zero on the y-axis — meaning Starbucks operates no stores in the country even though Colombian beans anchor its mainstream blends globally. A country can be among the most recognized coffee origins in the world while seeing essentially no retail investment from the brands that profit most from that reputation. The economic value created by growing and exporting specialty coffee does not accumulate where the coffee is grown.
p2 <- ggplot(
  quality_vs_retail,
  aes(x = median_score, y = sbux_stores)
) +
  geom_point(
    data  = filter(quality_vs_retail, highlight == "other"),
    color = art_secondary, size = 3.5, alpha = 0.7
  ) +
  geom_point(
    data = filter(quality_vs_retail, highlight != "other"),
    aes(color = highlight), size = 5, alpha = 0.95
  ) +
  geom_text(
    data = filter(quality_vs_retail, highlight != "other"),
    aes(label = country_of_origin, color = highlight),
    size = 3.2, hjust = -0.15, fontface = "bold"
  ) +
  geom_text(
    data = filter(quality_vs_retail,
                  highlight == "other",
                  sbux_stores > 50 | median_score > 83.5),
    aes(label = country_of_origin),
    color = art_mid, size = 2.6, hjust = -0.15
  ) +
  scale_color_manual(
    values = c(
      "Ethiopia" = art_highlight,
      "Mexico"   = art_secondary,
      "Colombia" = art_dark
    )
  ) +
  scale_y_continuous(labels = comma) +
  scale_x_continuous(breaks = seq(81, 85, 0.5)) +
  labs(
    title    = "Ethiopia Scores Highest. Starbucks Has Zero Stores There.",
    subtitle = "Median CQI cup score vs. Starbucks store count | Coffee-producing countries | 20+ quality samples",
    x        = "Median Total Cup Points",
    y        = "Starbucks Store Count",
    caption  = "Source: CQI via TidyTuesday (2020-07-07) + Starbucks locations via TidyTuesday (2018-05-07) | — ARTOMETRICS"
  ) +
  theme_artometrics() +
  theme(legend.position = "none")

ggsave("chart2_quality_vs_retail.png", p2,
       path = "charts", width = 12, height = 7, dpi = 300, bg = "white")
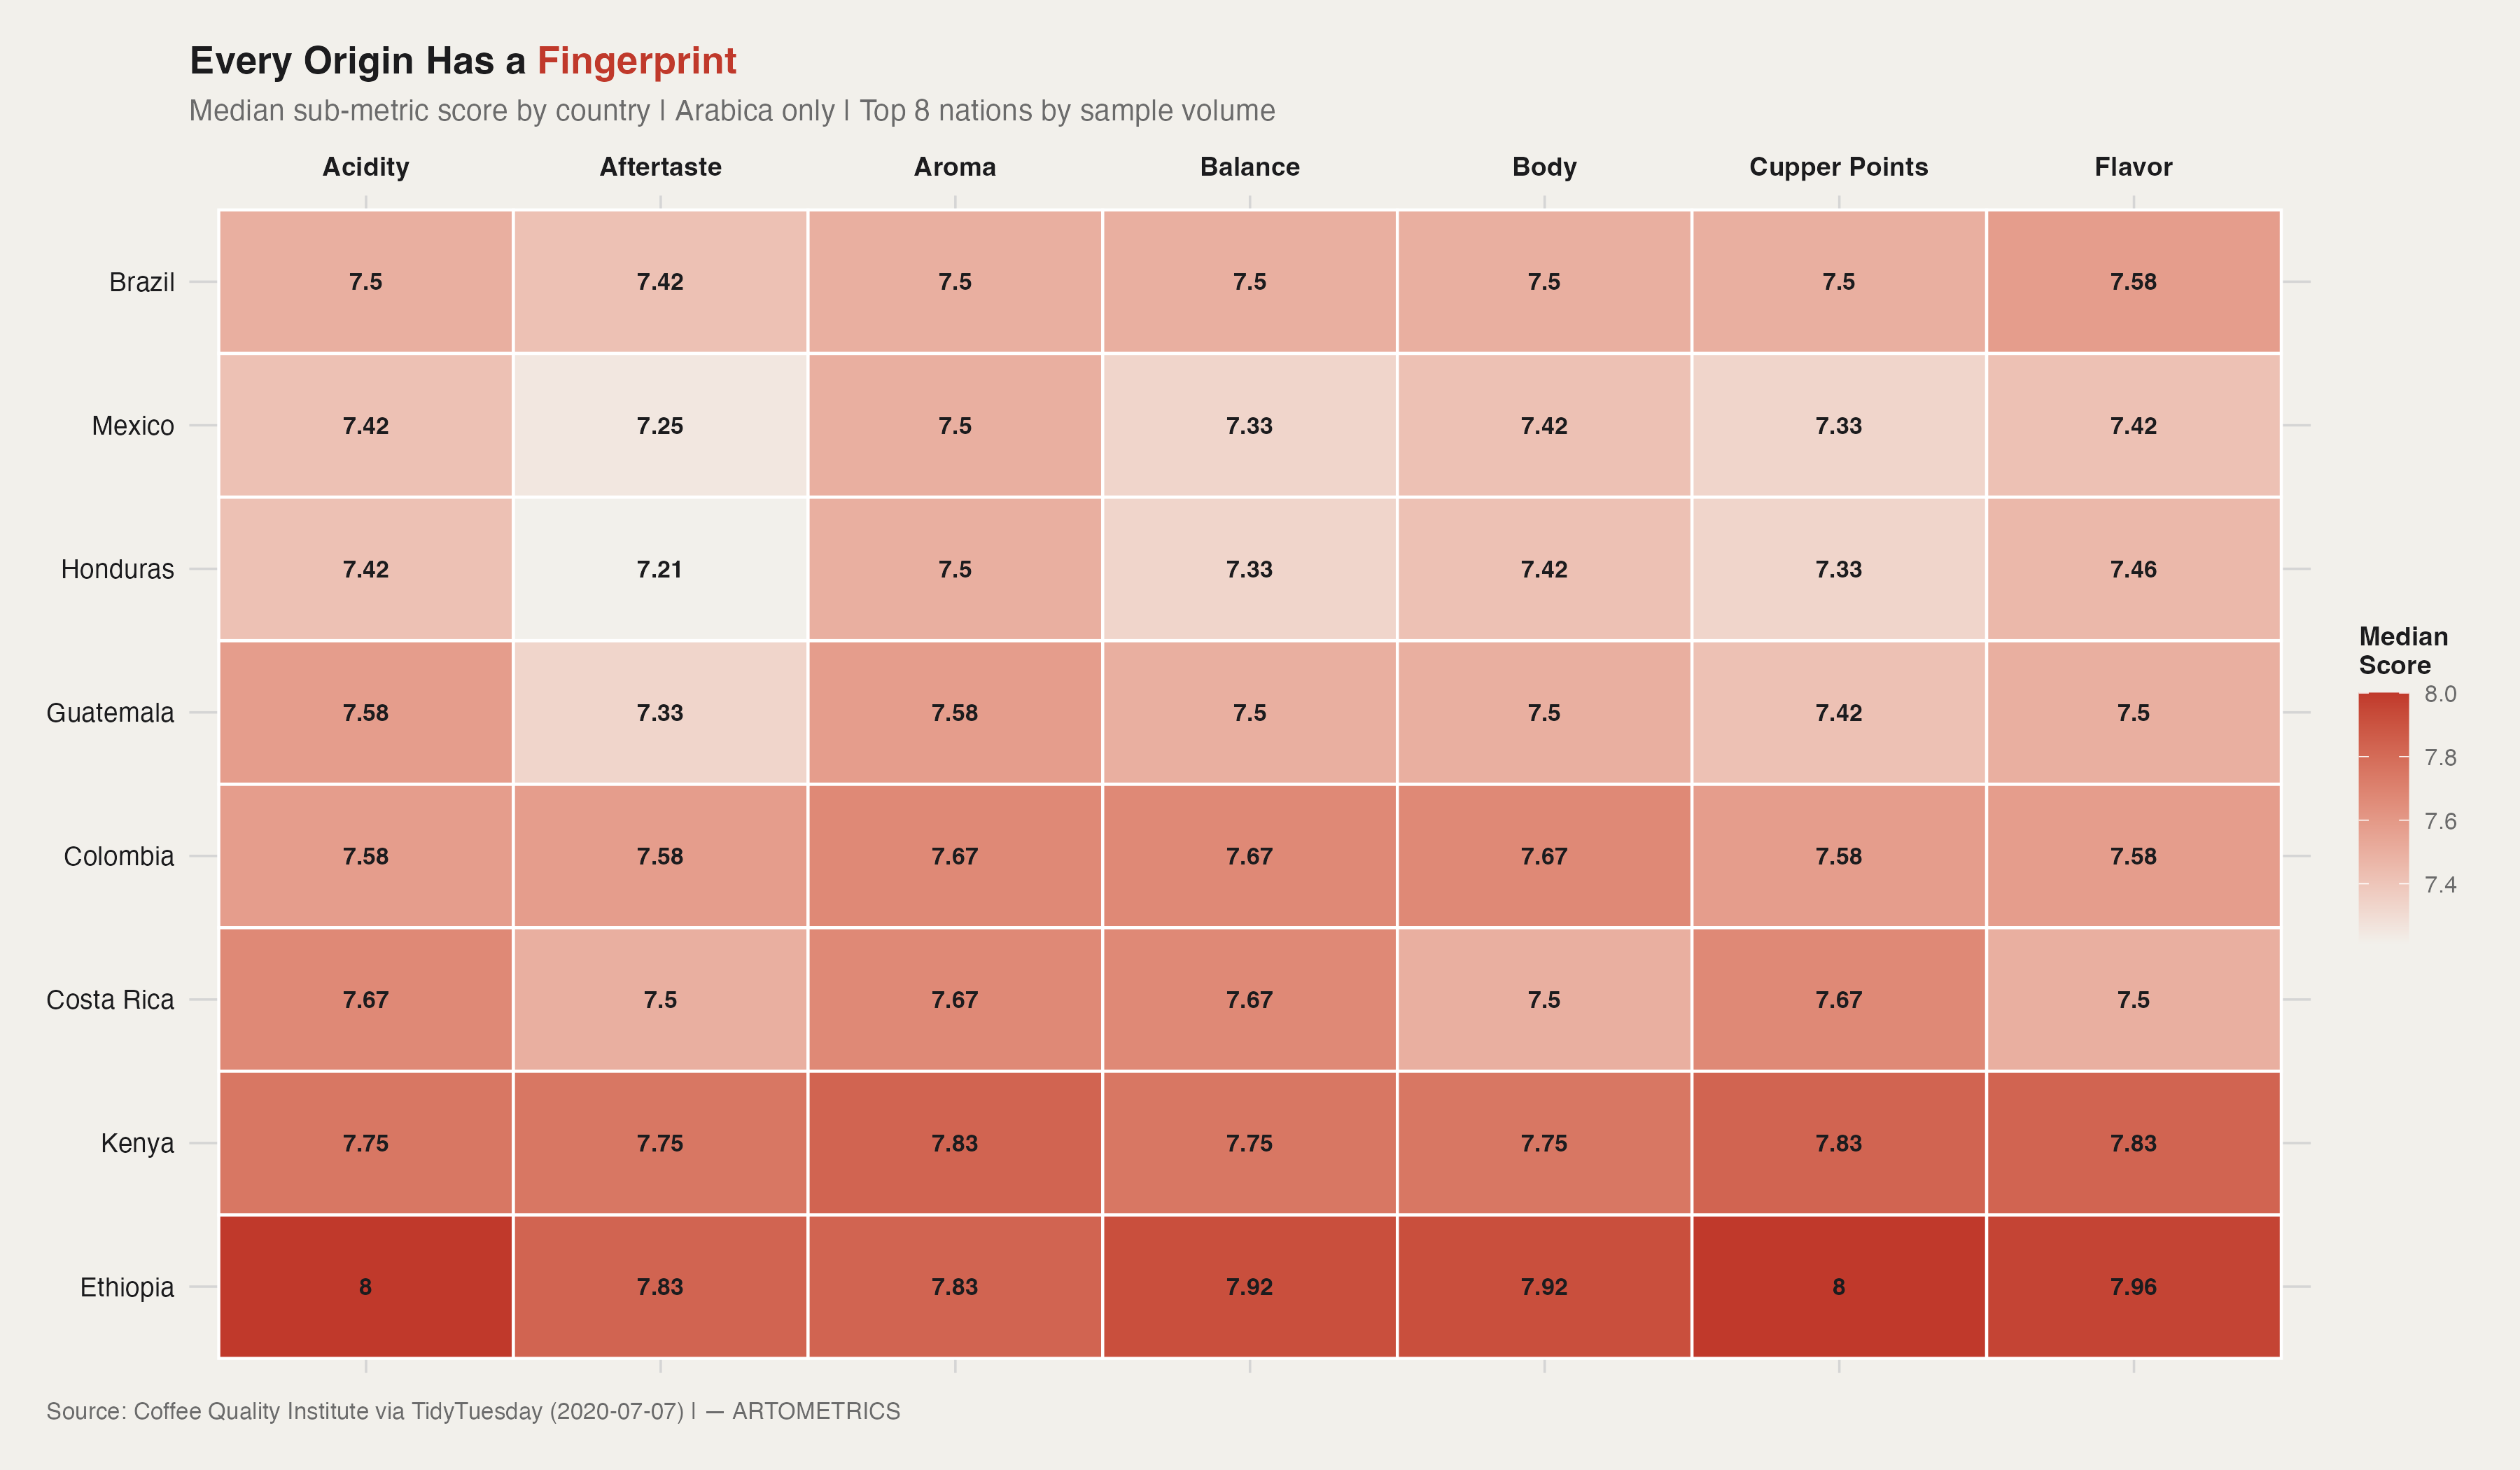
Ethiopia doesn't just score higher overall — it scores higher on every single sub-metric. Its median Acidity score of 8.0, Cupper Points of 8.0, and Flavor of 7.96 are the highest in this eight-country field across all seven attributes measured. Kenya comes close — particularly on Aroma (7.83) and Flavor (7.83) — but trails Ethiopia on five of seven metrics. The heatmap makes clear that Ethiopia's total cup score lead isn't driven by a single standout attribute. It's a structural advantage that runs through the entire sensory profile.
What the heatmap also reveals is how flat the remaining six countries are. Brazil sits at 7.42–7.58 across every dimension — not bad, but undifferentiated. Honduras and Mexico are almost indistinguishable: same Aroma scores (7.5 each), near-identical Acidity and Body. When buyers and roasters talk about commodity coffee, this is the data behind the phrase. Consistent, predictable, no single attribute that dominates or surprises.
Guatemala and Colombia both show elevated scores in Acidity and Balance, which maps to their market positioning as bright and balanced origins respectively. Colombia's 7.58 across Acidity, Aftertaste, Aroma, and Balance explains why it became the template for how mass-market coffee is described — not because it's the best, but because its profile translates well into easy consumer language. Specialty roasters call this approachability. The CQI data confirms it has a basis in fact.
p3 <- ggplot(
  coffee_heatmap,
  aes(x = metric, y = country_of_origin, fill = median_score)
) +
  geom_tile(color = "white", linewidth = 0.5) +
  geom_text(
    aes(label = round(median_score, 2)),
    color = art_dark, size = 2.9, fontface = "bold"
  ) +
  scale_fill_gradient(
    low  = art_cream,
    high = art_highlight,
    name = "Median\nScore"
  ) +
  scale_x_discrete(position = "top") +
  labs(
    title    = "Every Origin Has a Fingerprint",
    subtitle = "Median sub-metric score by country | Arabica only | Top 8 nations by sample volume",
    x        = NULL,
    y        = NULL,
    caption  = "Source: Coffee Quality Institute via TidyTuesday (2020-07-07) | — ARTOMETRICS"
  ) +
  theme_artometrics() +
  theme(
    panel.grid      = element_blank(),
    axis.text.x     = element_text(size = 9, face = "bold", color = art_dark),
    axis.text.y     = element_text(size = 9, color = art_dark),
    legend.position = "right"
  )

ggsave("chart3_submetric_heatmap.png", p3,
       path = "charts", width = 12, height = 7, dpi = 300, bg = "white")
The CQI dataset reflects what Q Graders evaluate — which is not the same as what the global coffee market produces. Samples enter the CQI system because producers, exporters, or buyers choose to submit them. That selection process is not random. Farms that can afford Q Grader evaluations tend to be larger operations or producers already integrated into specialty supply chains. This means lower-quality, subsistence-level production from the same origin countries is systematically underrepresented. Ethiopia's median score in this dataset may be genuinely high, but it is also the median of the coffees that Ethiopian producers chose to certify.
The Starbucks dataset is from 2018, which limits the currency of the retail analysis. Starbucks has expanded its African presence since then — notably in Morocco and South Africa — though it has not opened locations in Ethiopia, Kenya, or Uganda as of this writing. The directional finding holds, but the store counts should not be treated as current. More importantly, this report uses Starbucks as a proxy for global retail presence because its location data was available as a structured dataset via TidyTuesday. It is not a complete picture of the coffee retail industry — it captures one dominant chain, not the full landscape of cafés, grocery retail, or direct-to-consumer roasting.
Country-level analyses were filtered to origins with 20 or more CQI samples to avoid medians driven by one or two unrepresentative submissions. This threshold reduces the country pool from 36 to 16 but substantially improves the reliability of distributional comparisons. Origins with strong reputations in the specialty trade but fewer CQI submissions — Panama, Yemen, Burundi — are absent from the heatmap entirely, including varieties like Gesha that command the highest auction prices in the market.
The data makes an argument that the coffee industry has spent decades obscuring: quality and market power are not the same thing, and they don't flow in the same direction. Ethiopia produces the highest-rated coffee in the world by a significant margin. It has no Starbucks locations. Brazil is the world's largest coffee producer by volume and scores in the bottom half of this quality ranking. The countries that grow the best coffee are not the countries that capture the most economic value from it. That is not a market failure — it is how the market was designed.
The sub-metric fingerprint adds the mechanism. Colombia and Guatemala score well on the attributes that make coffee easy to describe and easy to sell — balanced acidity, clean finish, approachable profile. Ethiopia scores better on every dimension, but its complexity is harder to commodify. The scatter plot makes the consequence visible: the highest-scoring origins have no Starbucks presence not because Starbucks doesn't know about them, but because the economics of retail expansion have nothing to do with where the best coffee grows. Sourcing relationships and store locations are two entirely separate decisions.
What this report can't capture is what happens between the farm and the cup — the export chain, the roaster markup, the retailer margin. The CQI score is a measure of potential, not of who captures the value that potential creates. Ethiopia's Q Grader scores are extraordinary. Ethiopian coffee farmers remain among the lowest-paid agricultural workers in the global food system. Both of those things are true at the same time, and neither dataset in this report contradicts the other. The gap between quality and compensation is exactly where the interesting economics live.
TidyTuesday (2020-07-07). Coffee Ratings. R for Data Science Community. github.com/rfordatascience/tidytuesday/…/2020-07-07
TidyTuesday (2018-05-07). Coffee Chains. R for Data Science Community. github.com/rfordatascience/tidytuesday/…/2018-05-07
Coffee Quality Institute. (2020). Q Grader Program and Cupping Protocols. coffeeinstitute.org
Samper, L. F., & Quiñones-Ruiz, X. F. (2017). Towards a balanced sustainability vision for the coffee industry. Resources, 6(2), 17. doi.org/10.3390/resources6020017
Daviron, B., & Ponte, S. (2005). The Coffee Paradox: Global Markets, Commodity Trade and the Elusive Promise of Development. Zed Books.
Wintgens, J. N. (Ed.). (2009). Coffee: Growing, Processing, Sustainable Production (2nd ed.). Wiley-VCH.
This report was researched, written, designed, and produced in active collaboration with Claude AI (Anthropic). The data pipeline, statistical analysis, chart design, written analysis, narrative structure, and visual styling were all developed through a directed partnership between human editorial judgment and AI execution.
Artometrics was built on the premise that rigorous analysis and honest process are not in conflict. The research questions, editorial instincts, interpretive framing, and brand vision are ours. The execution — every line of R code, every paragraph of analysis, every design decision — was a collaboration. We document this not as a disclaimer but as a description of how we actually work, and as a position: we believe this is what serious data journalism looks like when the tools available are used honestly and at full capacity.
— Artometrics Editorial