POKEMON:The Artometrics of the World's Biggest Franchise

Pokémon is the highest-grossing media franchise in history — more than $150 billion in lifetime revenue across games, cards, merchandise, and film. That number gets cited constantly. What gets cited less is the design infrastructure underneath it: the 18-type system, the base stat framework, the generation-by-generation release cadence that has added roughly 100 new Pokémon every few years since 1996. The franchise looks like a cultural phenomenon. The data shows it's also an engineering project.
This report uses the TidyTuesday 2025-04-01 Pokémon dataset — sourced originally from PokéAPI and covering every Pokémon through Generation IX — to examine three questions. First, do different types actually play differently, or is that a perception? Second, has Game Freak been inflating Pokémon power over time? Third, what does physical size reveal about how Pokémon are designed? The answers are in the numbers, and the numbers are more interesting than the marketing.

The dataset is TidyTuesday Week 13, 2025 — a cleaned version of the PokéAPI database covering 1,028 Pokémon entries across nine generations. Each row represents a single Pokémon form, which means alternate forms (Mega Evolutions, regional variants, Gigantamax forms) appear as separate records from their base versions. The core fields used in this report are the six base stats (HP, Attack, Defense, Special Attack, Special Defense, Speed), base experience, primary type, height, weight, and generation ID. All values are drawn directly from the TidyTuesday source — no external APIs were joined for this analysis.
Base experience is a commonly misunderstood field. It is not the same as a Pokémon's base stat total, and it is not a measure of overall power. It is the amount of experience a trainer's Pokémon receives when defeating that species in battle — a game mechanic that reflects intended difficulty and progression pacing, not raw strength. A Pokémon with high base experience is meant to be encountered later in the game or to signal a harder fight. It correlates with power, but imperfectly.
Height and weight are stored in the dataset in their PokéAPI native units: decimetres for height and hectograms for weight. Both were converted to standard metric units (metres and kilograms respectively) before plotting. The log scale applied in Chart 3 is not a stylistic choice — the raw distributions span roughly four orders of magnitude, from Flabébé at 0.1 metres and 0.1 kilograms to Wailord at 14.5 metres and Cosmoem at 999.9 kilograms. A linear scale would make the chart unreadable.
One structural note on the generation variable: a small number of records in the raw dataset have a null generation ID, which would otherwise appear as a "Gen NA" row in Chart 2. These records were filtered before plotting. The most likely explanation is that they correspond to alternate forms introduced outside the standard generational release structure, though the TidyTuesday documentation does not clarify the source of the nulls explicitly.
-- Pokémon Artometrics: Dataset Spec
-- Source: TidyTuesday 2025-04-01 pokemon_df
-- All three charts draw from this single table — no external join required.

SELECT
    id,
    pokemon,
    generation_id,
    type_1,
    type_2,
    hp,
    attack,
    defense,
    special_attack,
    special_defense,
    speed,
    base_experience,
    height,       -- decimetres (divide by 10 for metres)
    weight,       -- hectograms (divide by 10 for kilograms)
    is_legendary,
    is_mythical

FROM pokemon_df

WHERE type_1 IS NOT NULL   -- drops records with no type assignment
  AND id     IS NOT NULL;

-- Chart 1: all Pokémon included, pivot stats long, median by type
-- Chart 2: exclude records with missing base_experience
-- Chart 3: exclude records with missing height or weight
import pandas as pd

# Load TidyTuesday 2025-04-01 Pokémon dataset
URL = (
    "https://raw.githubusercontent.com/rfordatascience/tidytuesday/"
    "main/data/2025/2025-04-01/pokemon_df.csv"
)
pokemon = pd.read_csv(URL)

# Basic inspection
print(pokemon.shape)
print(pokemon.dtypes)
print(pokemon.isnull().sum())

# Legendary / mythical count
n_leg = pokemon.query("is_legendary == True or is_mythical == True").shape[0]
print(f"Legendary + mythical: {n_leg}")

# Most common primary type
print(pokemon["type_1"].value_counts().head(5))
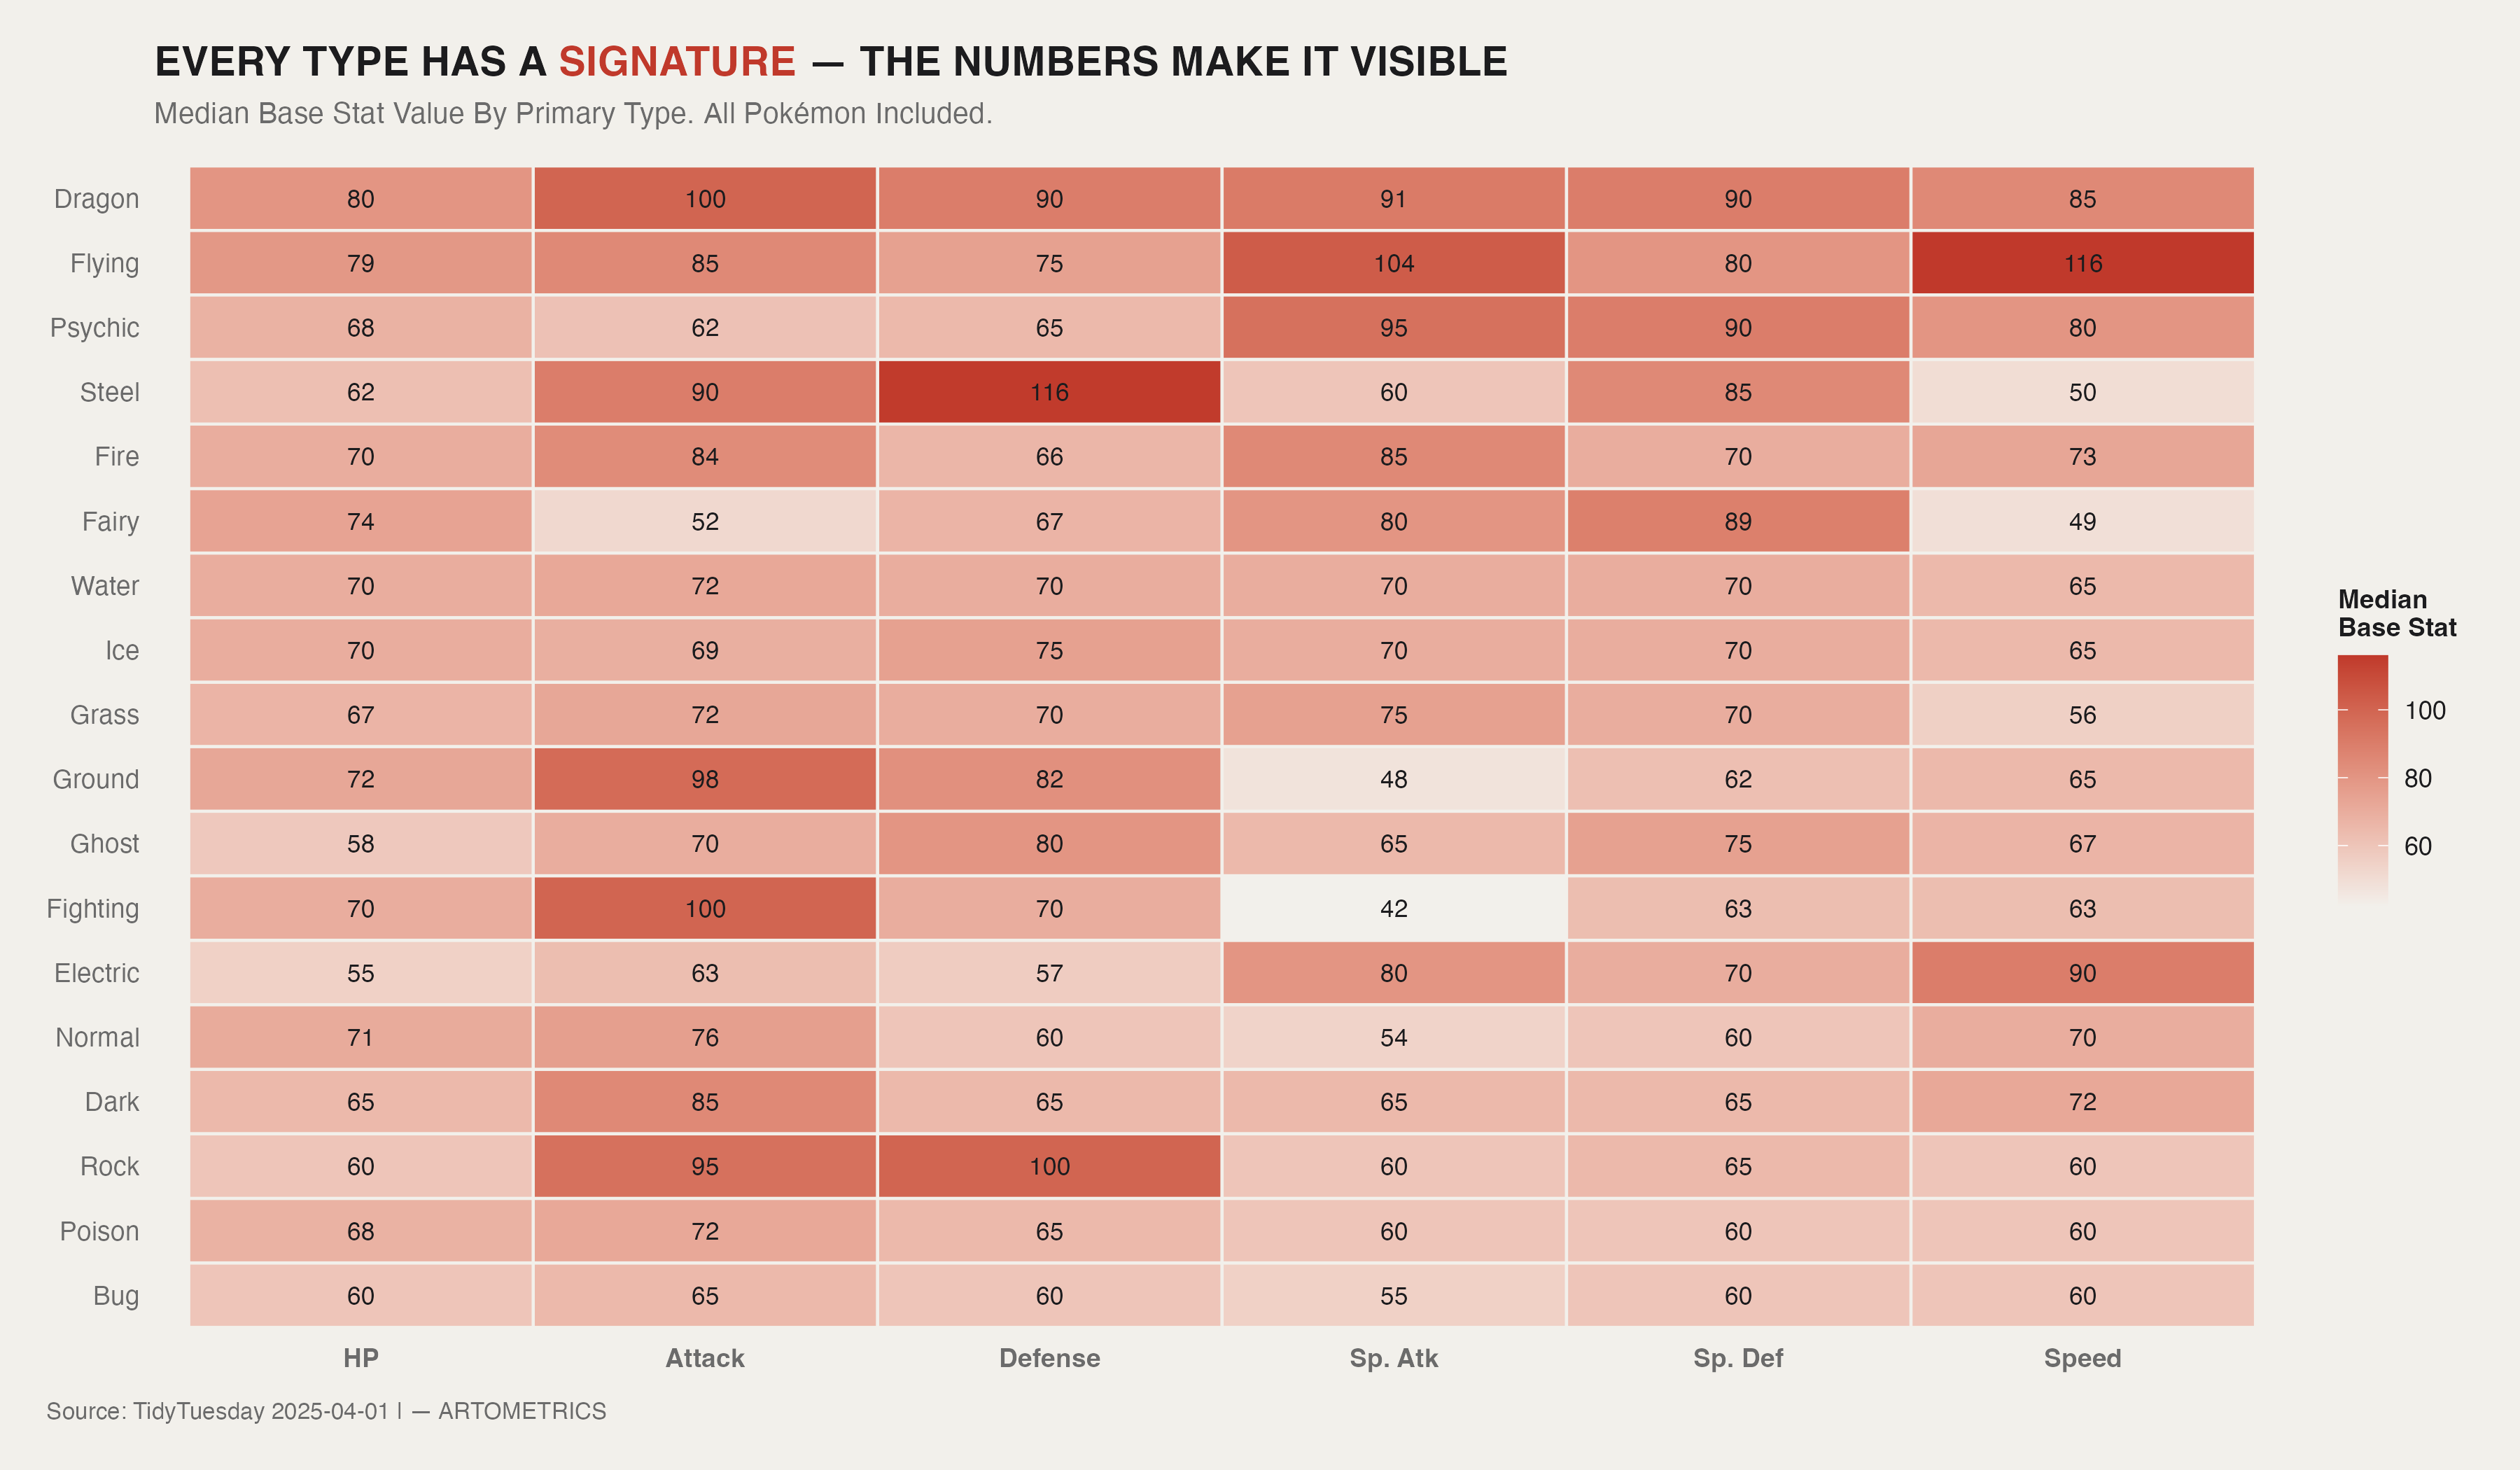
Dragon sits at the top of the heatmap for a reason. With a median Attack of 100 and no single stat below 80, Dragon-types are the closest thing Pokémon has to a generalist elite — high across the board, weak nowhere. The type wasn't always rare by accident. Game Freak made Dragon deliberately difficult to access in the early games because the numbers justified the gatekeeping.
The more revealing story is in the specialists. Steel-types clock a median Defense of 116 — the highest single cell on the entire chart — while their Special Attack sits at 60, dead last among Steel's own stats. Fighting-types mirror that tradeoff on offense: Attack of 100, Special Attack of 42, the sharpest stat gap in the dataset. These aren't balanced Pokémon. They're designed to do one thing extremely well and pay for it everywhere else. The heatmap makes that design philosophy impossible to ignore.
Bug sits alone at the bottom. Across all six stats, Bug-types post the lowest or near-lowest medians in every column — 60 HP, 65 Attack, 60 Defense, 55 Special Attack, 60 Special Defense, 60 Speed. The type has been statistically undertuned since Generation I and the data across nine generations confirms it hasn't been corrected. Whether that's a deliberate choice to keep early-game Pokémon weak or an oversight that calcified into canon, the result is the same: Bug-types are the worst-statted primary type in the game by a significant margin. One caveat worth noting: Flying appears near the top of the chart with an unusually high Speed median of 116, but Flying is almost never a primary type — it's almost always secondary. The dataset's primary Flying entries (Tornadus, Gyarados, Chatot, and a handful of others) are a small and unrepresentative sample, which inflates the type's apparent standing relative to how Flying Pokémon actually play in practice.
# Chart 1 — Stat Identity by Type
# Heatmap: median of each base stat by primary type

chart1_data |>
  ggplot(aes(x = stat, y = fct_reorder(type_1, median_val), fill = median_val)) +
  geom_tile(color = art_cream, linewidth = 0.5) +
  geom_text(aes(label = round(median_val, 0)), size = 3, color = art_dark) +
  scale_fill_gradient(low = art_cream, high = art_highlight, name = "Median\nBase Stat") +
  labs(
    title    = "EVERY TYPE HAS A SIGNATURE — THE NUMBERS MAKE IT VISIBLE",
    subtitle = "Median Base Stat Value By Primary Type. All Pokémon Included.",
    x = NULL, y = NULL,
    caption  = "Source: TidyTuesday 2025-04-01 | — ARTOMETRICS"
  ) +
  theme_artometrics() +
  theme(panel.grid.major = element_blank(), axis.text.x = element_text(face = "bold"))
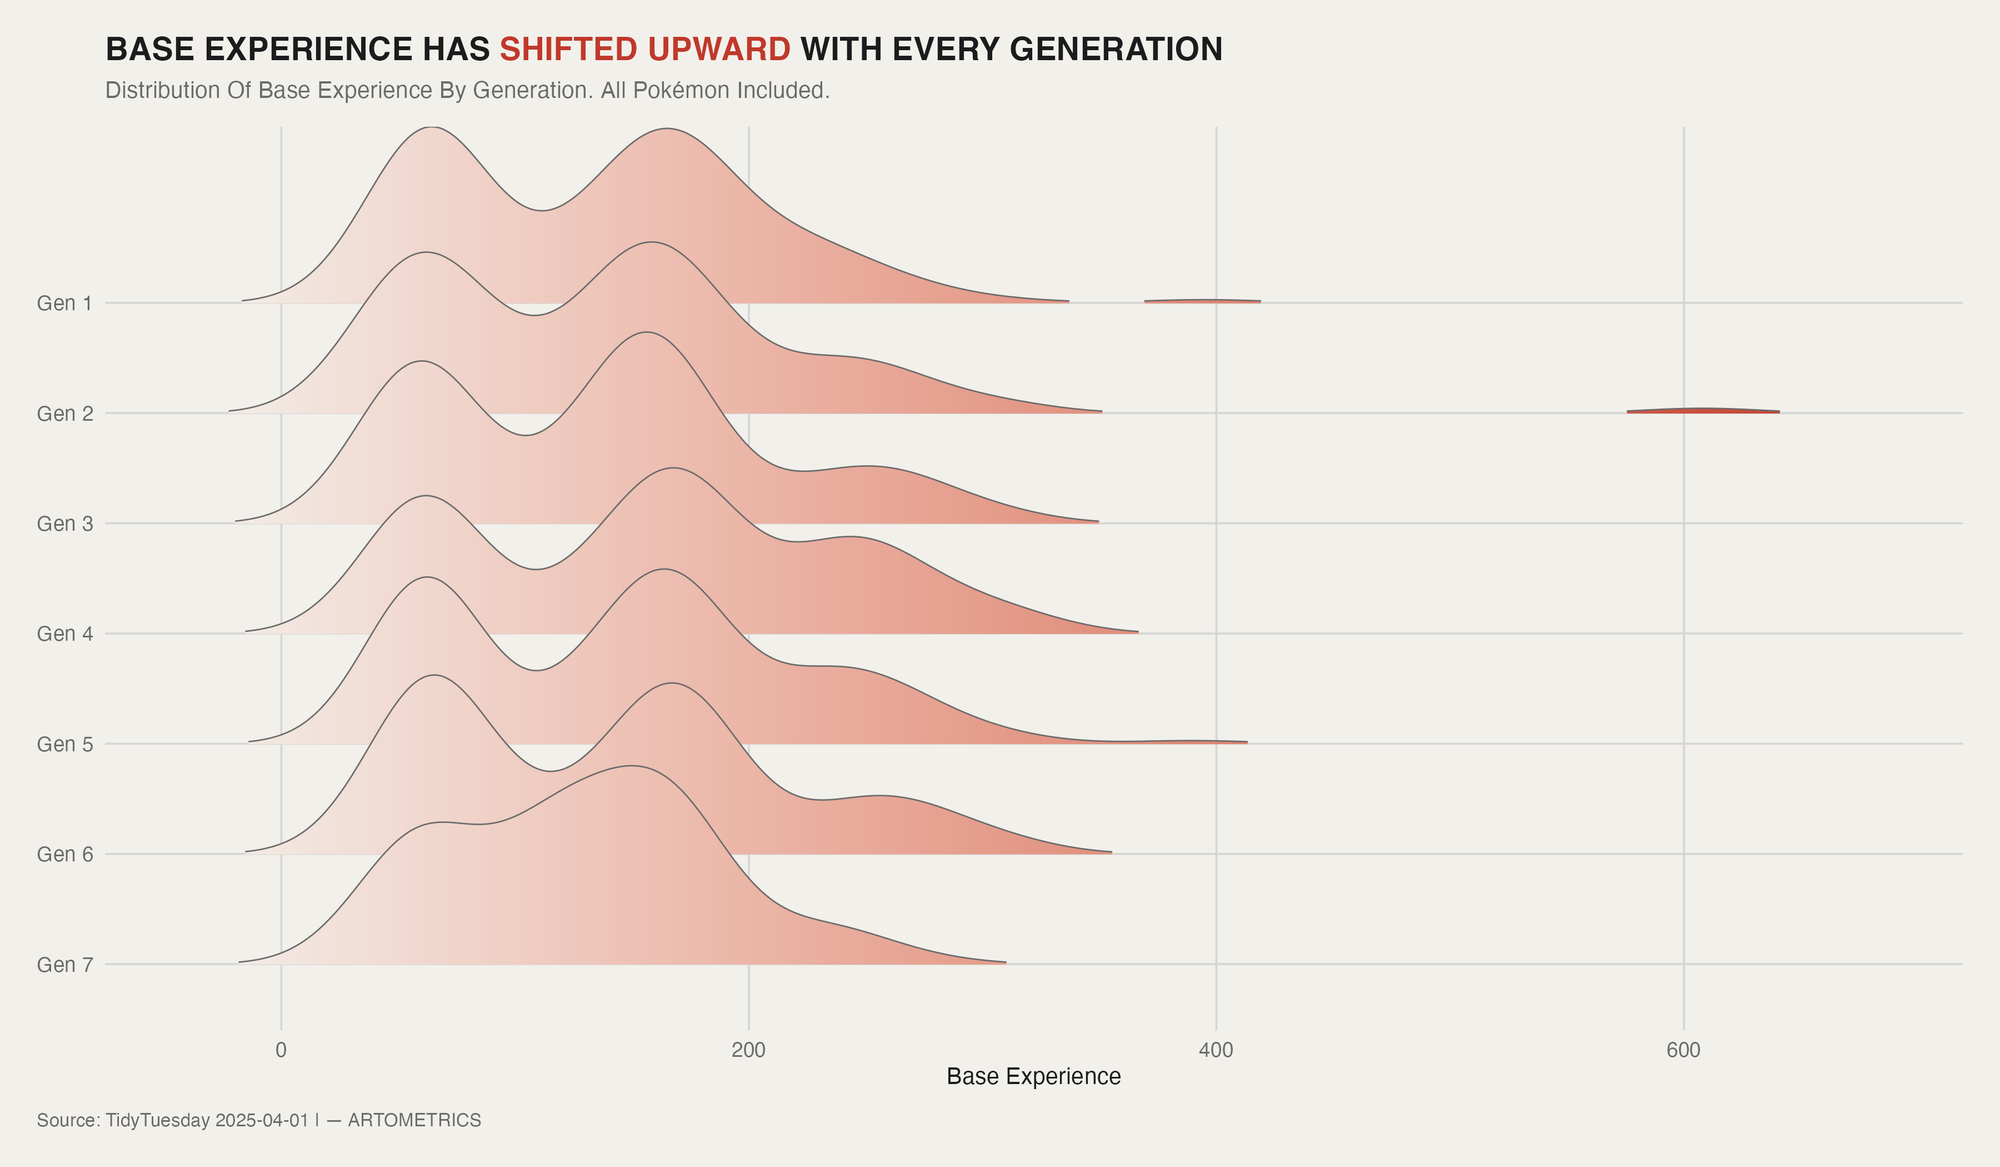
The ridgeline doesn't lie. Every generation from Gen 1 through Gen 7 shows the same basic distribution shape — a peak around 60–70 base experience on the left, a second hump around 150–170 for mid-tier Pokémon, and a long tail trailing off toward the high end. What changes is that tail. With each successive generation, it stretches a little further right. The center of mass isn't dramatically shifting, but the ceiling keeps rising.
The outliers tell the real story. That thin red thread extending past 600 on Gen 2's row is Blissey — a Normal-type with 255 base HP and the highest base experience yield of any Pokémon in the game at the time of its introduction. Gen 1 has its own isolated tail around 400, anchored by Chansey and the original legendary trio. These aren't flukes of the distribution — they're intentional design decisions that show up as statistical anomalies. Game Freak wasn't inflating power evenly across all Pokémon. They were adding extreme outliers at the top end while keeping the median relatively stable.
Gen 7's distribution is the most compressed of any generation — the narrowest spread, the sharpest peak, the least variance. That's partly a function of Game Freak introducing fewer fully-evolved Pokémon with extreme stat totals in Alola, and partly a reflection of a design era that prioritized Mega Evolutions and Z-Moves over raw base stat inflation. The shape of Gen 7's curve is what controlled power creep looks like. Whether Game Freak intended it or stumbled into it, the ridgeline is the evidence.
# Chart 2 — Generation Creep
# Ridgeline: base_experience distributions by generation

chart2_data |>
  ggplot(aes(x = base_experience, y = fct_rev(factor(generation)), fill = after_stat(x))) +
  geom_density_ridges_gradient(scale = 1.8, rel_min_height = 0.01,
                                color = art_mid, linewidth = 0.3) +
  scale_fill_gradient(low = art_cream, high = art_highlight, guide = "none") +
  scale_x_continuous(labels = comma) +
  labs(
    title    = "BASE EXPERIENCE HAS SHIFTED UPWARD WITH EVERY GENERATION",
    subtitle = "Distribution Of Base Experience By Generation. All Pokémon Included.",
    x = "Base Experience", y = NULL,
    caption  = "Source: TidyTuesday 2025-04-01 | — ARTOMETRICS"
  ) +
  theme_artometrics()
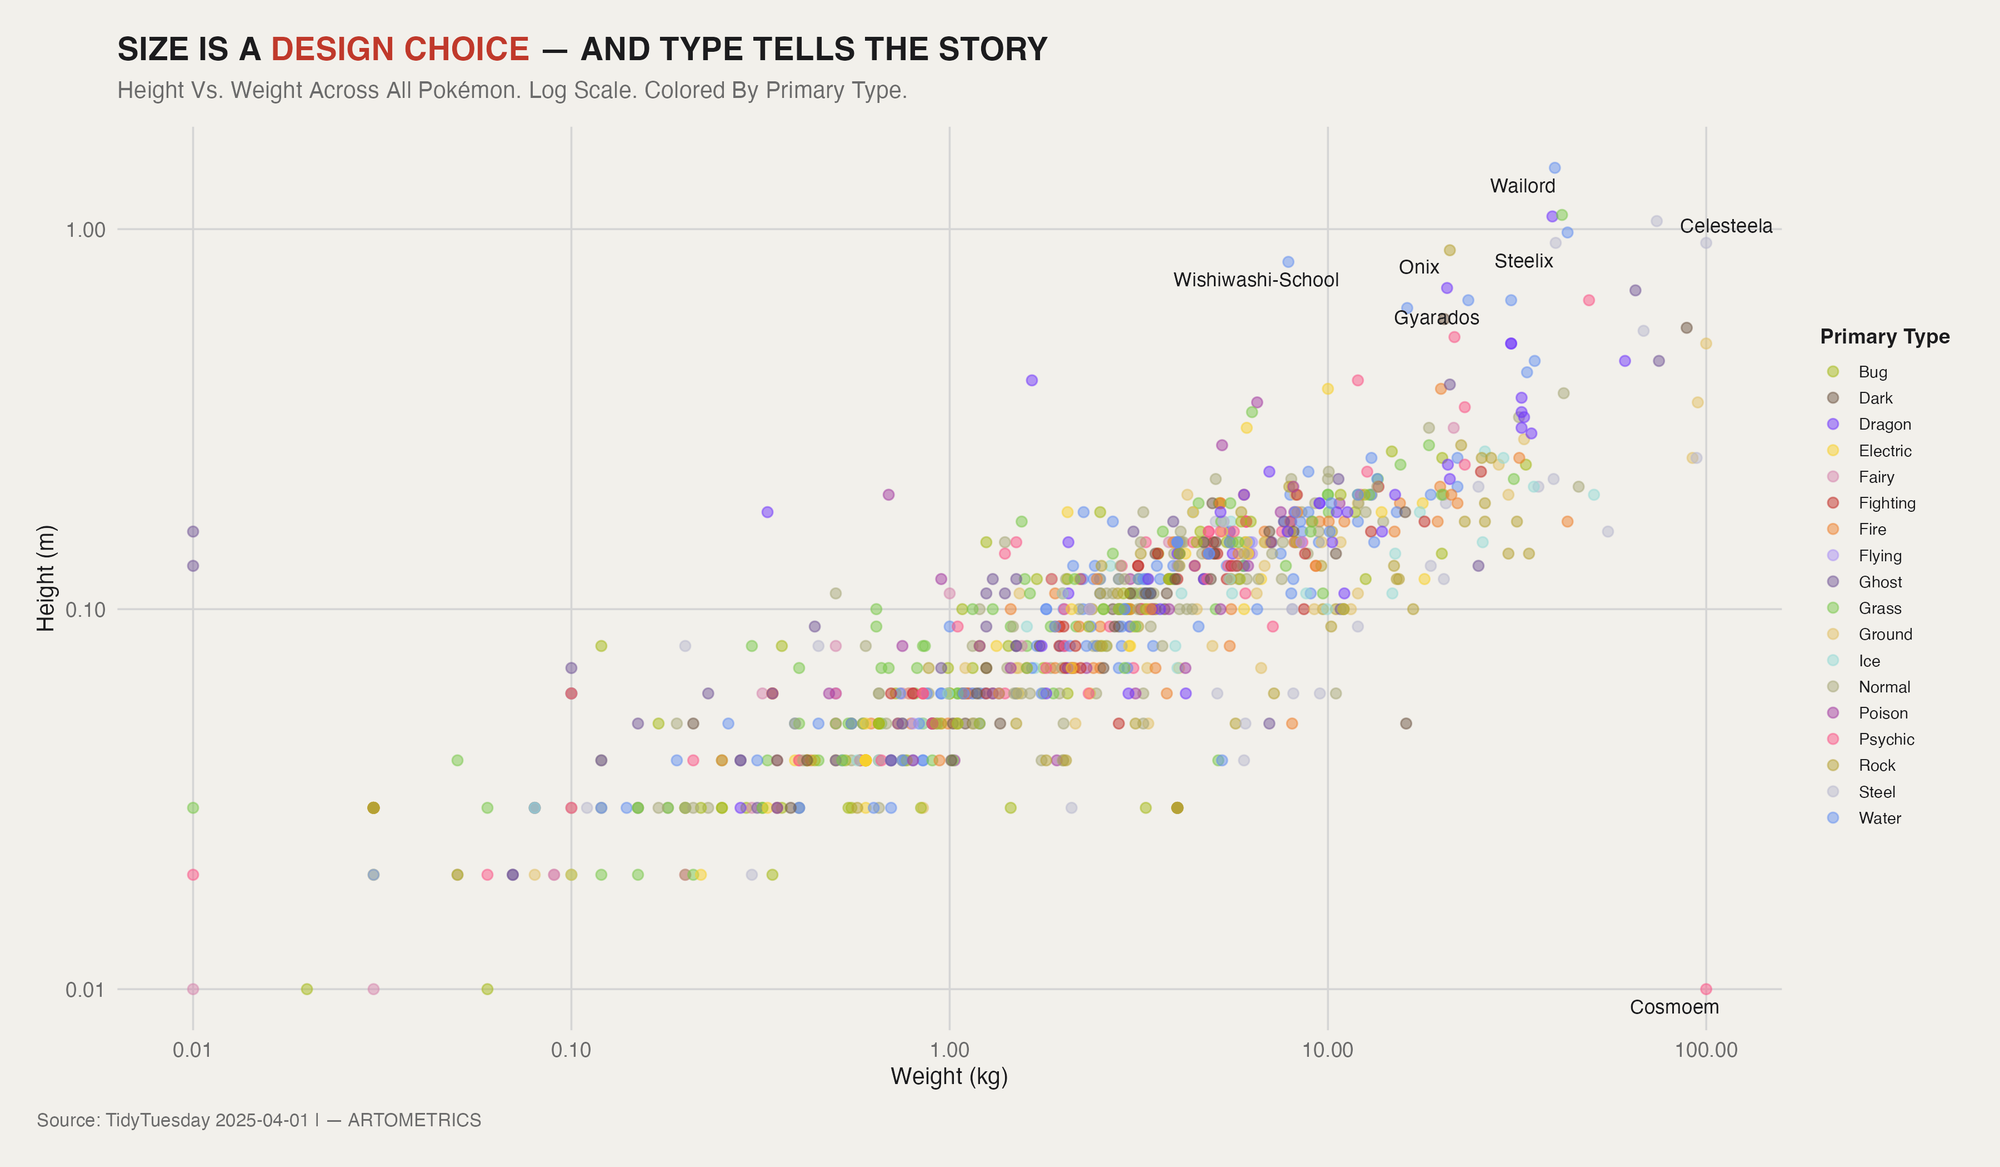
The first thing the scatter reveals is that Pokémon size follows a rule: heavier things are taller, and the relationship is consistent enough across 1,000+ Pokémon that the log-scale correlation is basically a straight line. Game Freak didn't design each Pokémon's physical dimensions independently — there's an implicit size grammar baked into the franchise, and almost every Pokémon obeys it. The exceptions are the entire point of the chart.
Cosmoem is the most extreme outlier in the dataset — 999.9 kg crammed into a body 0.1 meters tall, which puts it in the bottom-right corner of the chart completely alone. It weighs more than a polar bear and is smaller than a dinner plate. Wailord goes the other direction: 14.5 meters tall, 398 kg, making it one of the least dense objects in the Pokémon world despite being a whale. Celesteela, a Steel/Flying Ultra Beast, is nearly as heavy as Wailord and taller than a four-story building. These aren't design oversights — they're deliberate choices to make certain Pokémon physically impossible in ways that signal their otherness before you ever check their stats.
The type coloring doesn't produce clean clusters, but it does reveal soft patterns. Dragon-types (purple) and Water-types (blue) dominate the upper-right of the chart — the large, heavy end of the distribution. Bug-types (yellow-green) cluster densely in the small, light region on the left. Steel-types scatter across an unusually wide range, from the tiny Klefki to the massive Celesteela. What the scatter ultimately shows is that physical scale is a storytelling tool. The Pokémon at the extremes aren't there because of random number generation — they're there because someone at Game Freak decided that a 14-meter whale or a 999-kilogram cosmic cocoon needed to exist, and the data is just the record of that decision.
# Chart 3 — Built Different
# Scatter: height (m) vs. weight (kg), log scale, colored by primary type

chart3_data |>
  ggplot(aes(x = weight_kg, y = height_m, color = type_label)) +
  geom_point(alpha = 0.5, size = 1.8) +
  ggrepel::geom_text_repel(
    data = chart3_labels, aes(label = str_to_title(pokemon)),
    size = 3, color = art_dark, family = "Helvetica",
    max.overlaps = 20, segment.color = art_muted
  ) +
  scale_x_continuous(name = "Weight (kg)", labels = comma, trans = "log10") +
  scale_y_continuous(name = "Height (m)", trans = "log10") +
  scale_color_manual(name = "Primary Type", values = c(
    "Normal" = "#A8A77A", "Fire" = "#EE8130", "Water" = "#6390F0",
    "Electric" = "#F7D02C", "Grass" = "#7AC74C", "Ice" = "#96D9D6",
    "Fighting" = "#C22E28", "Poison" = "#A33EA1", "Ground" = "#E2BF65",
    "Flying" = "#A98FF3", "Psychic" = "#F95587", "Bug" = "#A6B91A",
    "Rock" = "#B6A136", "Ghost" = "#735797", "Dragon" = "#6F35FC",
    "Dark" = "#705746", "Steel" = "#B7B7CE", "Fairy" = "#D685AD"
  )) +
  labs(
    title    = "SIZE IS A DESIGN CHOICE — AND TYPE TELLS THE STORY",
    subtitle = "Height Vs. Weight Across All Pokémon. Log Scale. Colored By Primary Type.",
    caption  = "Source: TidyTuesday 2025-04-01 | — ARTOMETRICS"
  ) +
  theme_artometrics() +
  theme(legend.position = "right", legend.text = element_text(size = 7),
        legend.key.size = unit(0.4, "cm"))
The most significant limitation of this analysis is scope: the dataset covers base stats and physical attributes, but Pokémon competitive viability is determined by factors this data doesn't capture. Abilities, move pools, type matchups, held items, and EV/IV systems all affect how a Pokémon actually performs in battle. A Bug-type with low base stats can still be competitively viable if it has the right ability — Scizor has been a top-tier competitive Pokémon for years despite its type disadvantage, largely due to its access to Bullet Punch and Technician. The numbers here describe design intent, not gameplay outcomes.
The generation variable has a known data quality issue: a subset of records carry null generation IDs, most likely alternate forms or entries added outside the standard generational release structure. These were filtered from Chart 2 rather than imputed, which means the ridgeline distributions reflect only records with confirmed generation assignments. The omitted records are a small fraction of the total dataset and are unlikely to meaningfully change the shape of any generation's distribution.
Finally, the dataset reflects a single snapshot of PokéAPI data compiled for the TidyTuesday release in April 2025. Base stats, forms, and classifications are subject to change with new game releases and balance patches — particularly for Scarlet and Violet, which introduced a large number of new forms and mechanics that may not be fully represented in this version of the data. Any analysis of the most recent generations should be treated as preliminary.
The type system isn't just flavor. Dragon-types are statistically elite by design, Bug-types are statistically weak by design, and the specialists in between — Steel's defense, Fighting's attack, Electric's speed — reflect intentional tradeoffs embedded in the numbers from the beginning. The heatmap makes 25 years of Game Freak's design philosophy legible in a single chart. Every type has a signature, and the data confirms it.
Power creep is real but it's not uniform. The median Pokémon hasn't gotten dramatically more powerful across nine generations — the distribution shape is remarkably stable from Gen 1 to Gen 7. What has changed is the ceiling. Each generation adds a small number of outliers at the extreme high end: a Blissey, a legendary trio, an Ultra Beast. The franchise inflates not by pulling the average up but by making the top more extreme. That's a different kind of creep, and it's harder to notice until you plot it.
The size scatter is the most human chart of the three. It shows that somewhere inside Game Freak, someone made a decision to create a whale that weighs less than a car and a cosmic dust mote that weighs more than a horse. Those aren't statistical accidents — they're creative decisions that left a data signature. That's the throughline of this entire report: the Pokémon franchise is enormous and commercially optimized and thoroughly analyzed by millions of fans, but underneath all of it is a set of design choices made by people, and the numbers are how you read them.
Data Science Learning Community. (2025). TidyTuesday: A weekly social data project. Week 13, 2025 — Pokémon. https://tidytues.day
Ito, S. (Producer), & Tajiri, S. (Director). (1996). Pocket Monsters Red and Green [Video game]. Nintendo / Game Freak.
PokéAPI. (2025). The RESTful Pokémon API. https://pokeapi.co
Bulbapedia contributors. (2025). Base experience. Bulbapedia, the community-driven Pokémon encyclopedia. https://bulbapedia.bulbagarden.net/wiki/Base_experience
This report was researched, written, designed, and produced in active collaboration with Claude AI (Anthropic). The data pipeline, statistical analysis, chart design, written analysis, narrative structure, and visual styling were all developed through a directed partnership between human editorial judgment and AI execution.
Artometrics was built on the premise that rigorous analysis and honest process are not in conflict. The research questions, editorial instincts, interpretive framing, and brand vision are ours. The execution — every line of R code, every paragraph of analysis, every design decision — was a collaboration. We document this not as a disclaimer but as a description of how we actually work, and as a position: we believe this is what serious data journalism looks like when the tools available are used honestly and at full capacity.
— Artometrics Editorial