FRANCHISE: The Artometrics of Media Monopolies
A data analysis of 107 franchises mapping how the most valuable IP in history — from Pokémon to Star Wars — actually makes its money.

A data analysis of 107 franchises mapping how the most valuable IP in history — from Pokémon to Star Wars — actually makes its money.

The media franchise business is not what it looks like from the outside. The films, the games, the shows — those are the marketing. The real product is the license. This analysis uses the TidyTuesday 2019 dataset of 107 franchises, each with at least $4B in lifetime revenue, to map exactly how the most valuable IP in history actually makes its money — and why the answer is almost always the same.
The TidyTuesday 2019 media franchises dataset covers 107 properties, each with at least $4B in estimated lifetime revenue as of mid-2019. The figures are sourced from Wikipedia's list of highest-grossing media franchises and compiled into eight revenue categories: Merchandise, Licensing & Retail; Video Games/Games; Box Office; Home Video/Entertainment; Comic or Manga; Music; TV; and Book Sales. Every franchise in this dataset has already cleared a threshold that most IP never approaches — this is not a representative sample of the media industry. It is a map of its ceiling.
The $4B floor is not a small number. Most films, shows, games, and books that ever existed never come close to it. Being in this dataset means a property has sustained commercial relevance across multiple revenue streams, often across multiple decades. The franchises below that line — culturally significant, critically acclaimed, beloved — are simply absent. What remains is the top tier: the IP that didn't just succeed but compounded.
Revenue here is a lifetime estimate, not an annual figure. A franchise created in 1923 has had a century to accumulate; one created in 2013 has had six years. That asymmetry shapes every chart. Chart 1 rewards longevity. Chart 2 corrects for it. Chart 3 strips everything down to a single question: how much of what you earn comes from merchandise? The answer, for most of these franchises, is almost all of it.
Revenue Breakdown by Category, Top 20 Franchises
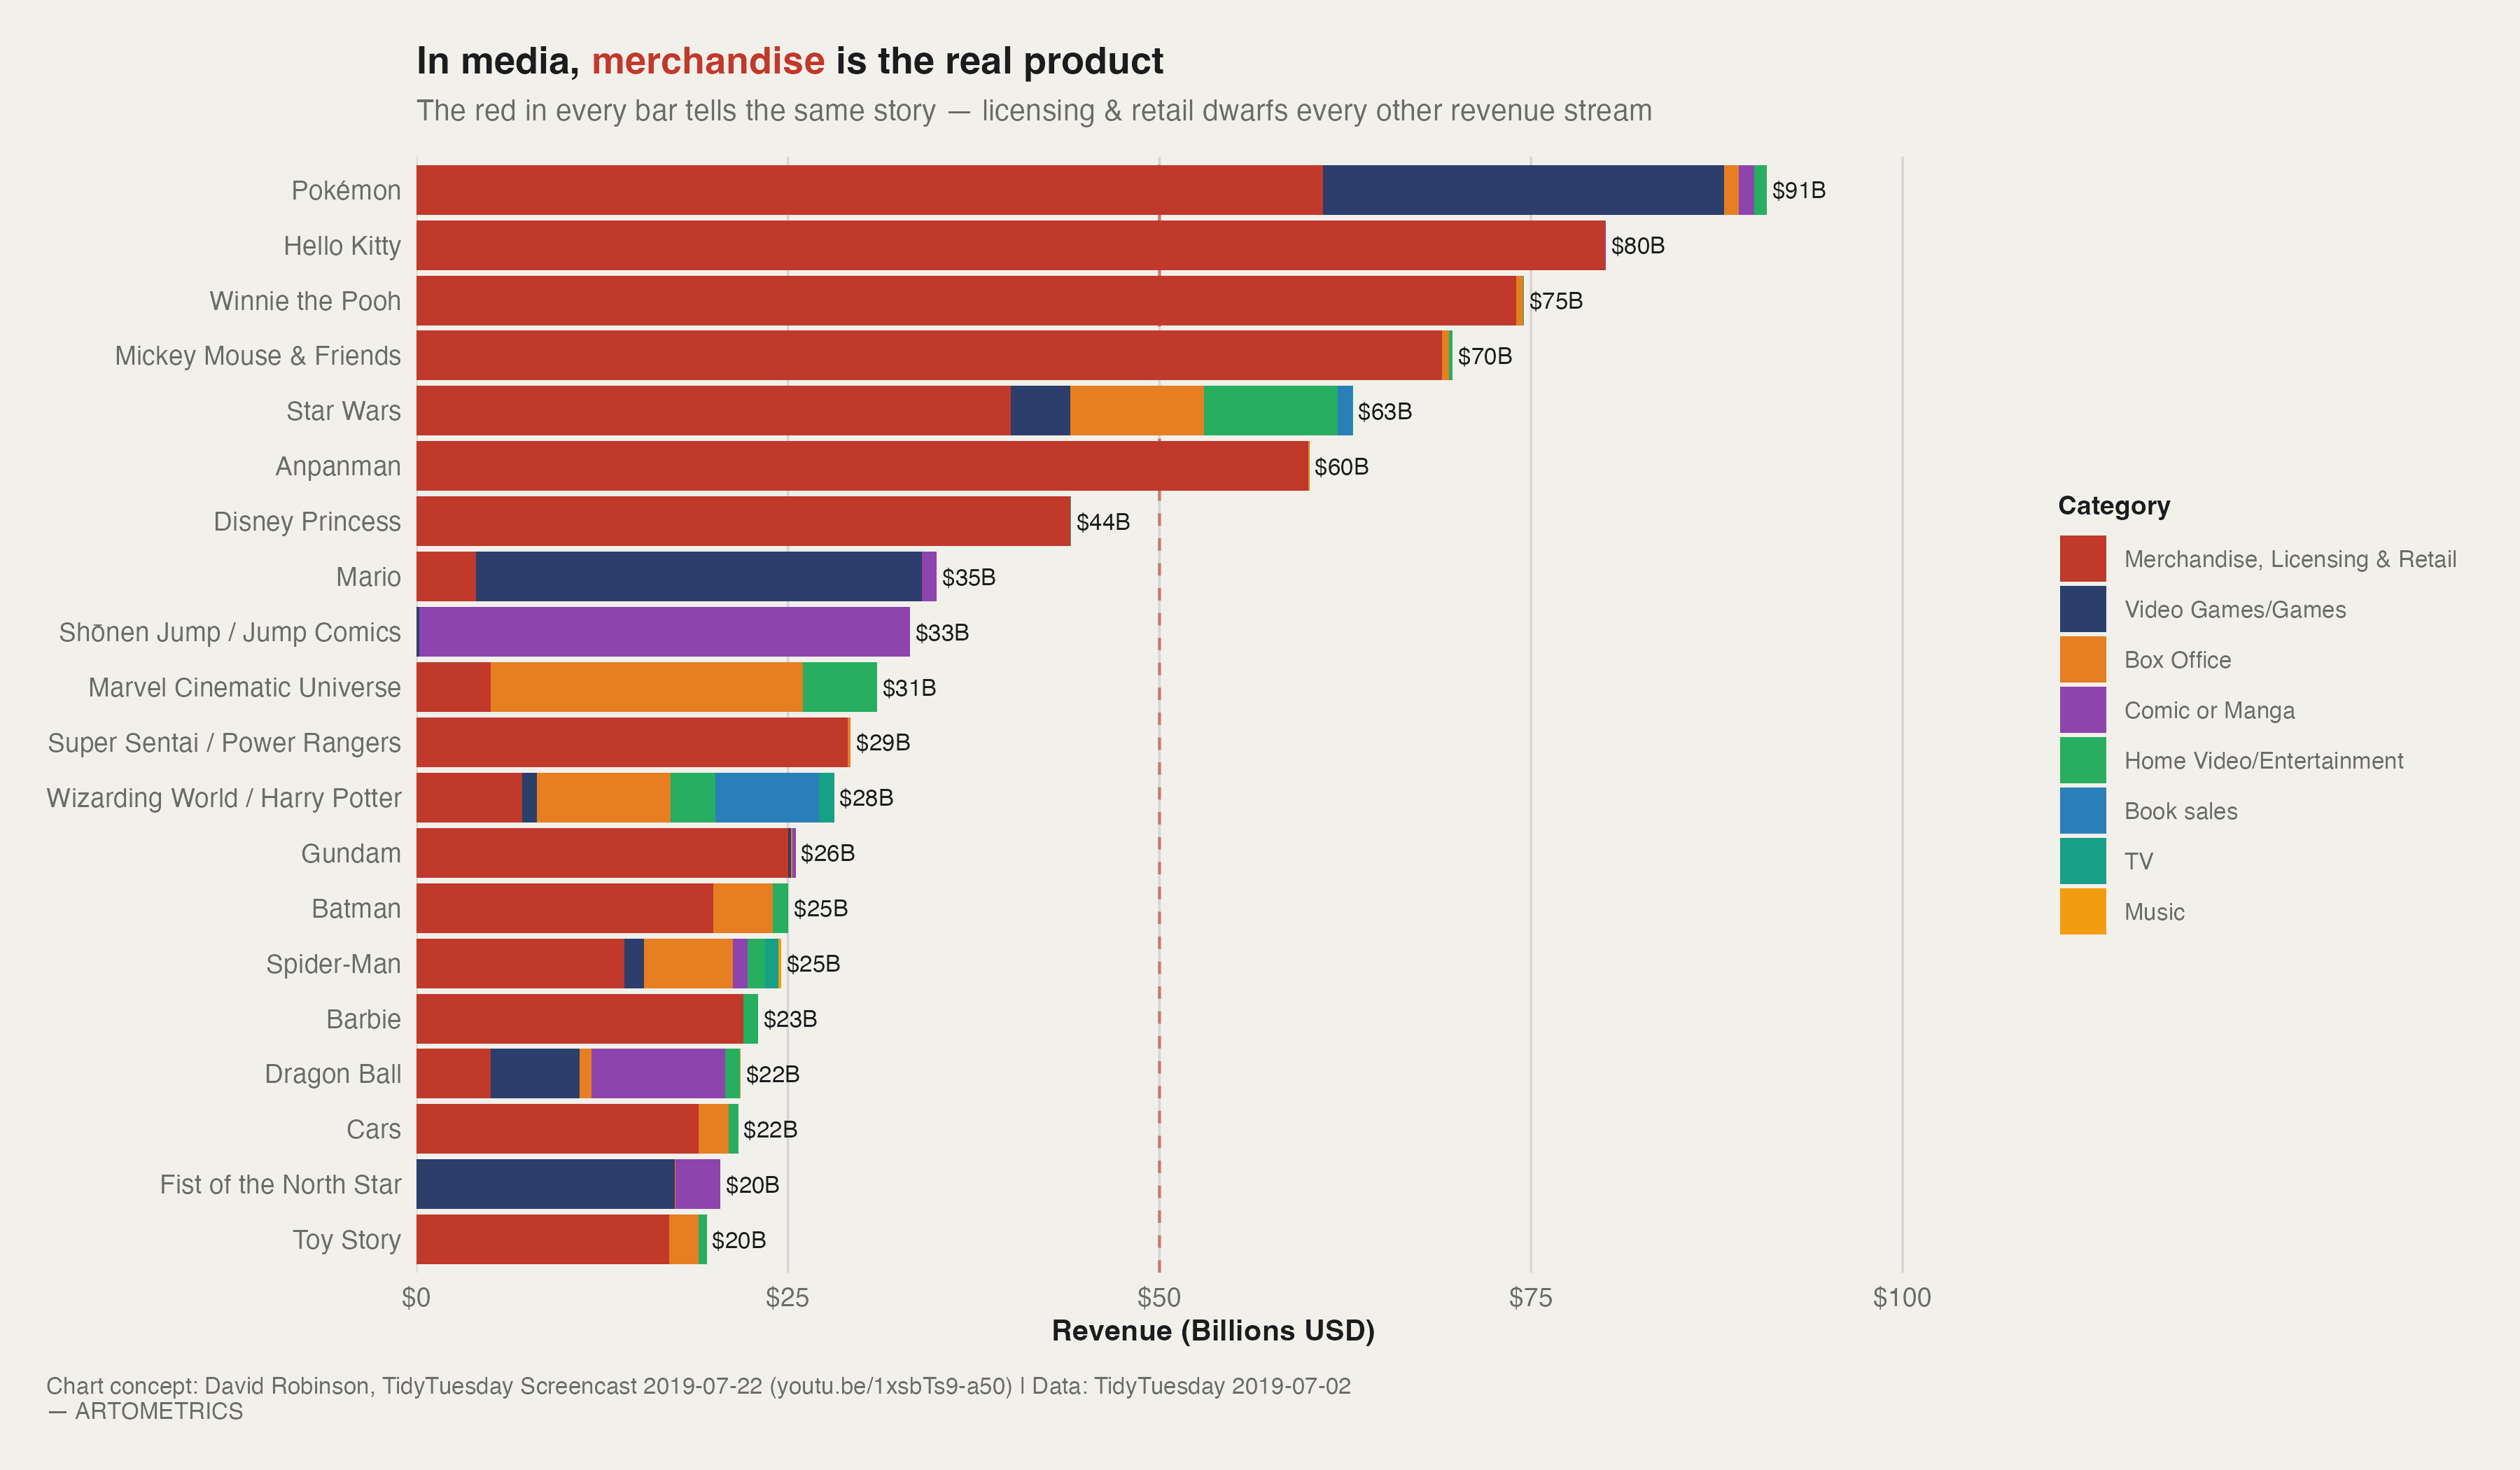
Pokémon at $91B is not just the top of this chart — it is a different kind of number. The gap between Pokémon and second-place Hello Kitty ($80B) is itself larger than the total lifetime revenue of Batman, Spider-Man, Barbie, or Dragon Ball. This is what it looks like when a franchise achieves structural escape velocity: the compounding effect of merchandise revenue over decades, driven by a product line that expands into every available category simultaneously — cards, video games, plush, clothing, themed food, theme park attractions, and an anime that has functioned primarily as a 25-year commercial for the card game. Pokémon was not built to be a franchise. It was built to be an economy.
The color logic of this chart is the argument. Merchandise, Licensing & Retail (red) dominates the fill for nearly every bar in the top 20. This is not a quirk of how Wikipedia compiles revenue figures — it is a structural feature of how large-scale media IP actually makes money. The content — the films, the games, the episodes — functions primarily as marketing infrastructure for the real product, which is the license. Every time a child watches a Winnie the Pooh episode, they are being cultivated as a future customer for plush animals, backpacks, and themed birthday party supplies. The entertainment is the demand generator. The merchandise is the business.
Three franchises in the top 20 break visibly from the red-dominant pattern, and each is instructive. Mario is mostly dark blue — Video Games/Games — because Nintendo has spent decades resisting the licensing temptation that Disney and Sanrio embraced fully. Mario merchandise exists, but Nintendo's core strategy is to keep the IP tightly coupled to its own hardware ecosystem. Shōnen Jump / Jump Comics is mostly purple (Comic or Manga), because Jump's revenue structure is fundamentally a publishing business — it sells magazines and tankōbon volumes, not T-shirts. And Star Wars shows the most balanced mix in the top 20: box office, merchandise, home video, and games each contributing meaningfully. Star Wars is the model of a fully diversified franchise — which is both its greatest strength and the reason Disney paid $4 billion for Lucasfilm in 2012.
Anpanman at $60B is the franchise most likely to surprise a Western reader. It is entirely invisible in American pop culture, but it is one of the most dominant children's IP properties in Japan — a bread-faced superhero created by Takashi Yanase in 1973 that appears on virtually every consumer product category in the country. Its revenue is almost entirely merchandise. Anpanman's placement at #6, above Disney Princess, Spider-Man, and the MCU, is a useful corrective to the assumption that "global" and "valuable" are synonyms. The most commercially successful IP does not have to cross cultural borders — it just has to dominate its home market completely and then sustain that dominance across generations.
The dashed red line marks $50B, and only four franchises cross it: Pokémon, Hello Kitty, Winnie the Pooh, and Mickey Mouse & Friends. All four share the same structural DNA: they were created between 1923 and 1974, they are character-first (not story-first) IP, and they generate revenue almost entirely through merchandise rather than theatrical releases or episodic content. The fifty-billion threshold is not an arbitrary marker — it represents the outcome of five or more decades of compounding licensing agreements, and it is realistically unreachable for any franchise created after 1990 on a comparable timeline. The only modern franchise with a plausible path there is Pokémon, which is already there.
This chart is a revenue ranking, not a cultural impact ranking, and the distinction matters. Several franchises with enormous cultural influence are absent or low here because their impact was not primarily monetized through the tracked categories. The dataset only includes franchises that crossed $4B in estimated revenue — already filtering out a massive portion of the IP landscape — and the revenue estimates themselves are Wikipedia-sourced approximations, not audited financial statements. Read this chart as a measurement of commercial scale, not prestige, depth of influence, or narrative quality. Those are different measurements, and they produce different rankings.
Which Franchise Is the Most Efficient Money-Making Machine?
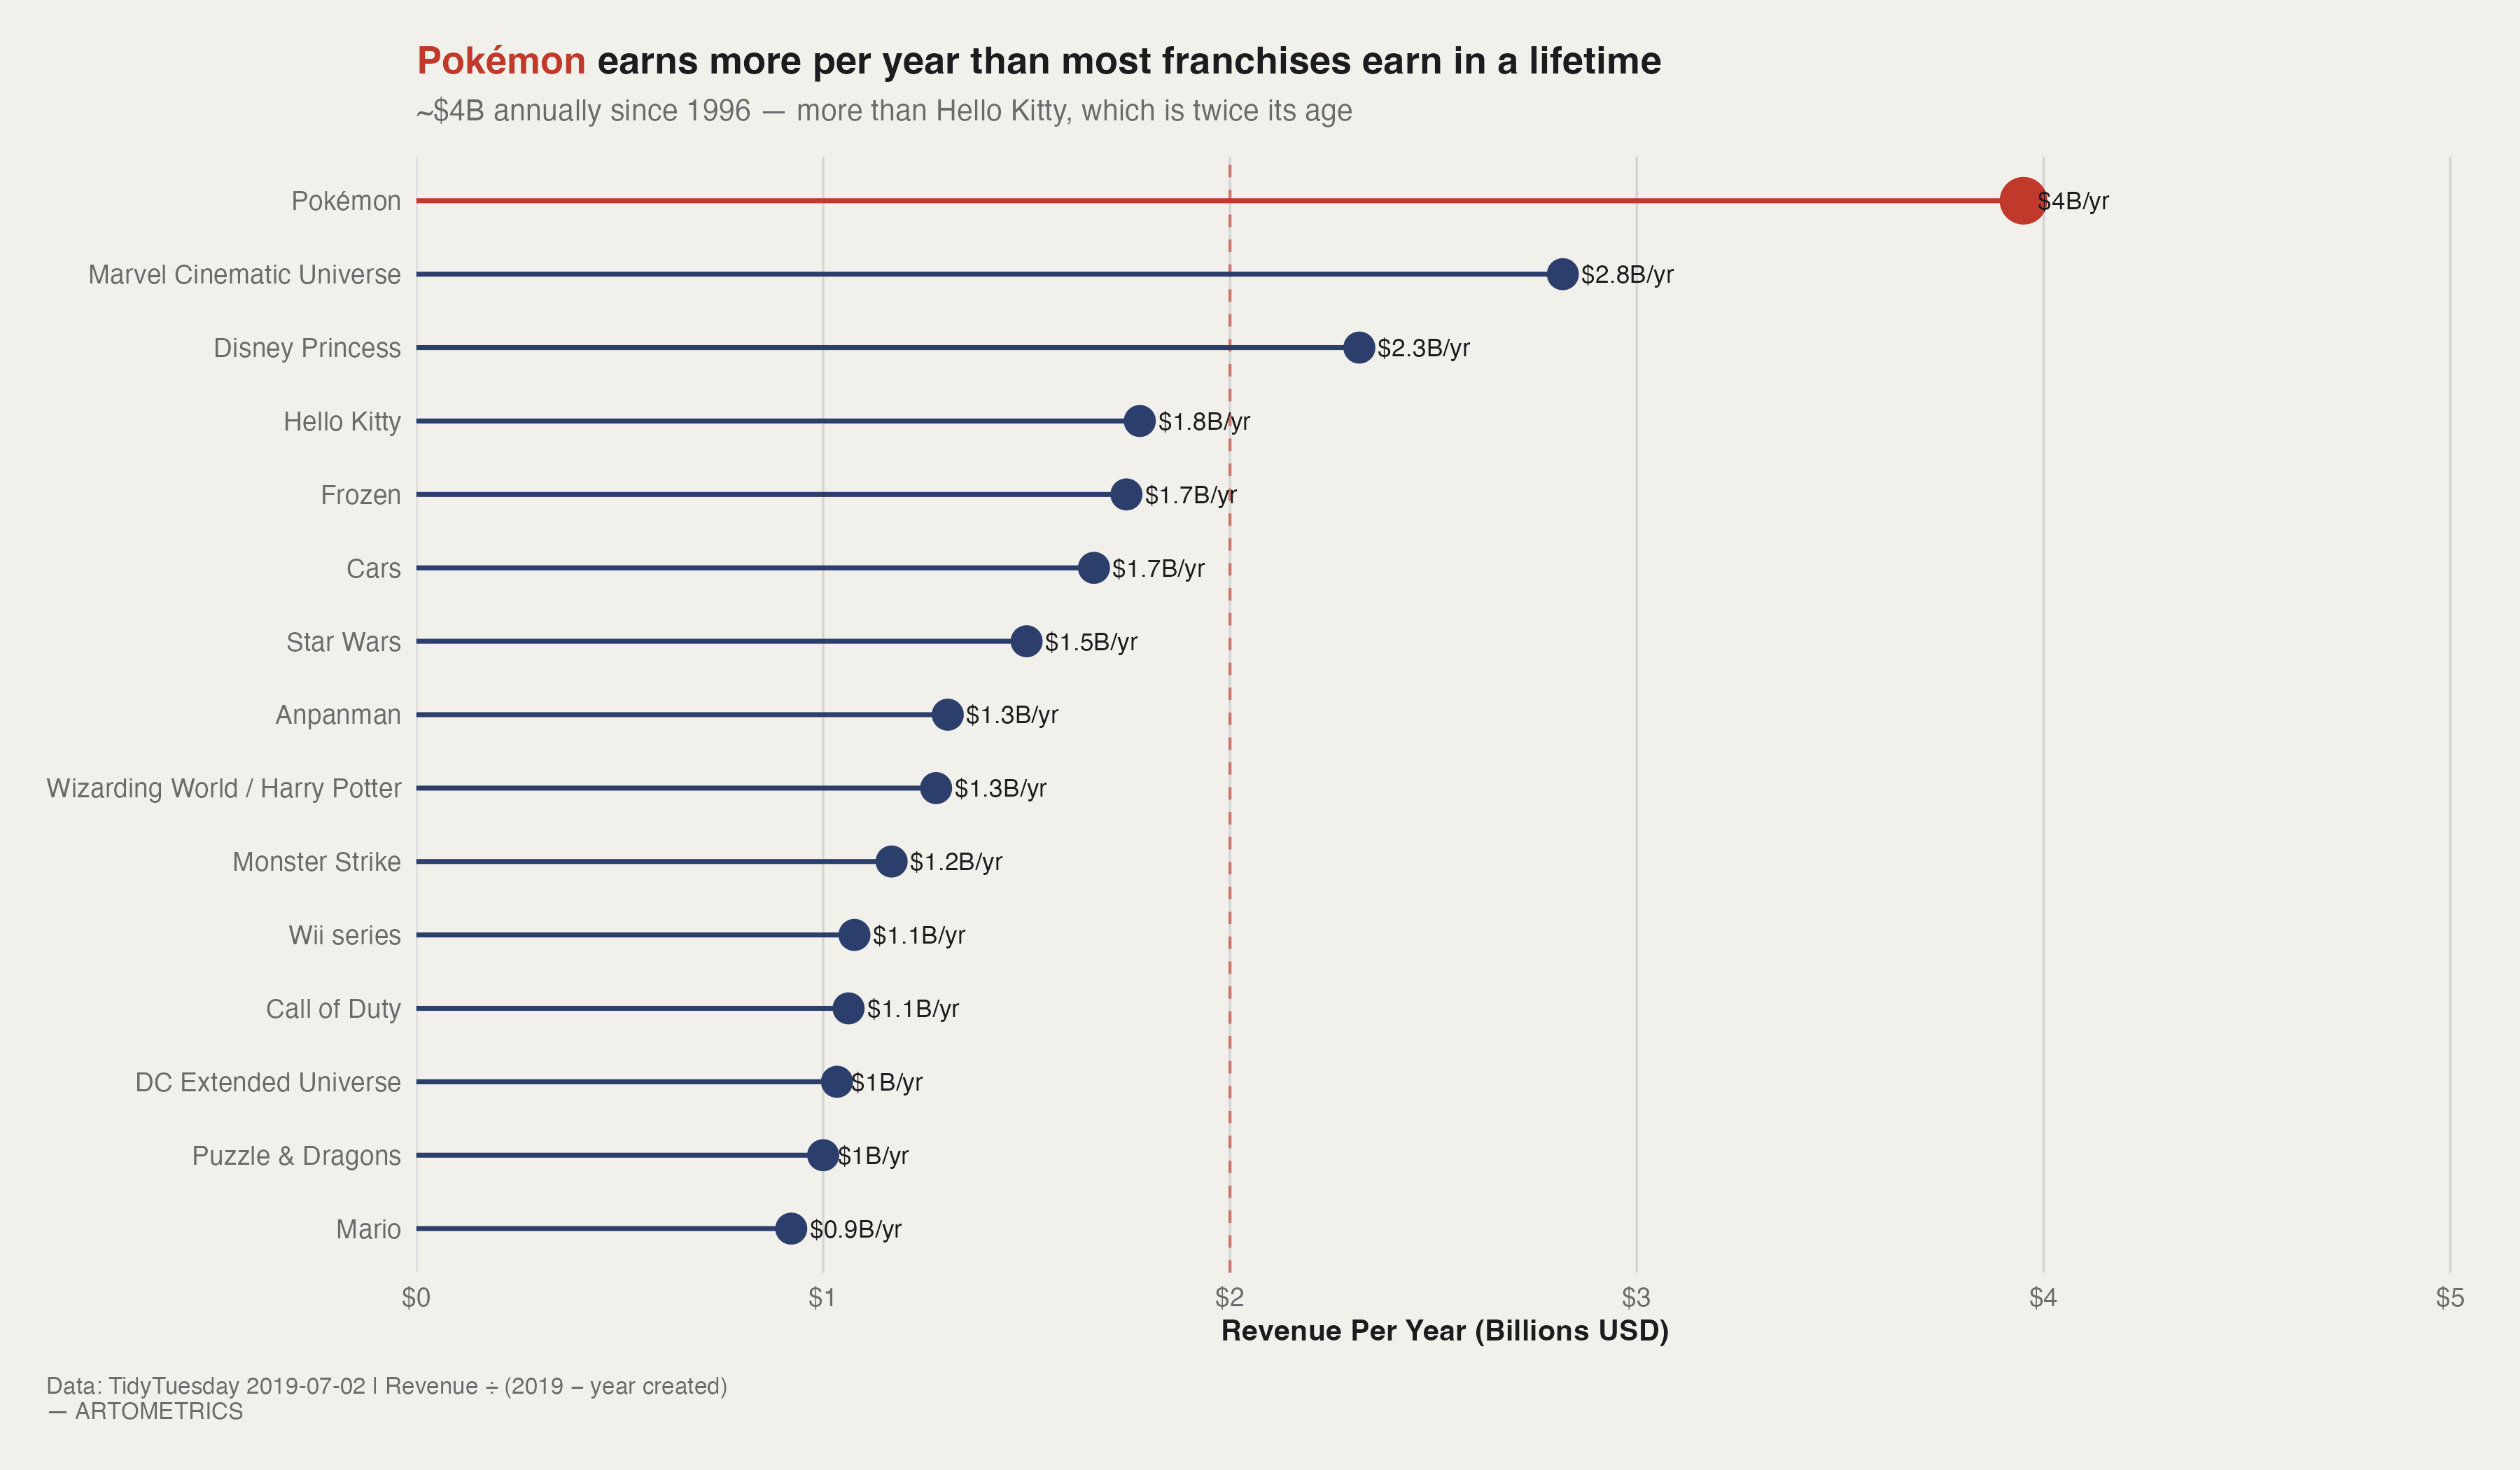
Total revenue rewards longevity. Revenue per year rewards efficiency. These are different measurements, and the chart that results from choosing the latter produces a meaningfully different ranking — one that strips away the structural advantage of age and asks a harder question: how much value does this franchise generate per year of its existence? A franchise created in 1928 has had 91 years to accumulate revenue. One created in 1996 has had 23. Normalizing by time puts them on comparable footing, and the result is a reordering that surfaces some of the most analytically interesting IP in the dataset — and exposes some long-running giants for the slower earners they actually are on an annualized basis.
At $4B per year since 1996, Pokémon is not just the most efficient franchise in this dataset — it is operating in a category by itself. The gap between Pokémon and second-place Marvel Cinematic Universe ($2.8B/yr) is proportionally larger than the gap between the MCU and the bottom of this chart. What makes Pokémon structurally anomalous is that its efficiency cannot be attributed to a single revenue driver. The trading card game, the video game series (which consistently breaks Nintendo hardware sales records at launch), the anime (which aired its first episode in 1997 and has never stopped), the theatrical films, and merchandise licensing all operate simultaneously and reinforce each other. Pokémon is not a franchise that earns well from one thing. It is a franchise that earns from everything, at once, all the time.
Several franchises that ranked very high on total revenue drop significantly when normalized by time. Hello Kitty, second in total revenue at $80B, falls to fourth at $1.8B/yr — because it has been generating that revenue since 1974, making its 45-year run the denominator that brings the rate down. Winnie the Pooh and Mickey Mouse drop further still, not because they underperform, but because their massive lifetime totals are the product of nearly a century of operation. That is its own remarkable achievement. But the per-year lens is unforgiving to age: a franchise that earns $1B a year for 90 years scores lower on this chart than one that earns $2B a year for 25.
The Marvel Cinematic Universe was launched with Iron Man in 2008, making it one of the youngest properties in this chart at 11 years old as of 2019. Its $2.8B/yr efficiency is explained by the most deliberate franchise engineering project in Hollywood history. Disney's acquisition of Marvel for $4 billion in 2009 was almost immediately justified: The Avengers (2012) grossed over $1.5B globally on its own. By 2019 the MCU had produced 23 films with a combined box office exceeding $22B, plus merchandise, home video, and licensing revenue that multiplied the total. The MCU's high per-year efficiency is not an accident of luck — it was the product of systematic narrative planning across multiple phases, an aggressive release cadence, and cross-film character marketing that converted every individual movie into an advertisement for the next one.
Both Frozen and Cars appear on this chart at approximately $1.7B/yr, and their presence together illustrates something precise about Disney's merchandise operation. Neither is a long-running series — Frozen debuted in 2013 and Cars in 2006, making them among the youngest IP here. Their efficiency is almost entirely merchandise driven. Frozen generated more in licensing revenue than The Avengers in the year of its release, driven by an Elsa-branded product demand that emptied store shelves globally through 2014. Cars is arguably the most commercially successful Pixar franchise despite being critically underrated, because its vehicle-based IP translates into one of the highest-performing toy categories in retail history. Disney did not just make popular films. It built IP that converts into retail product with exceptional precision.
The $2B per year dashed line functions as a natural breakpoint. Above it: Pokémon, the MCU, and Disney Princess — three franchises operating at what might be called institutional revenue scale. Below it: twelve franchises that are commercially dominant by any conventional measure but haven't reached that annualized level. The cluster between $1B and $2B/yr — Frozen, Cars, Star Wars, Anpanman, Harry Potter, Monster Strike, Wii, Call of Duty, DC Extended Universe, Puzzle & Dragons, and Mario — still represents a scale that most IP never approaches. The $2B line is not a verdict on quality or cultural significance. It is a marker of structural rarity.
How Dependent Are the Top 15 Franchises on Merch Revenue?
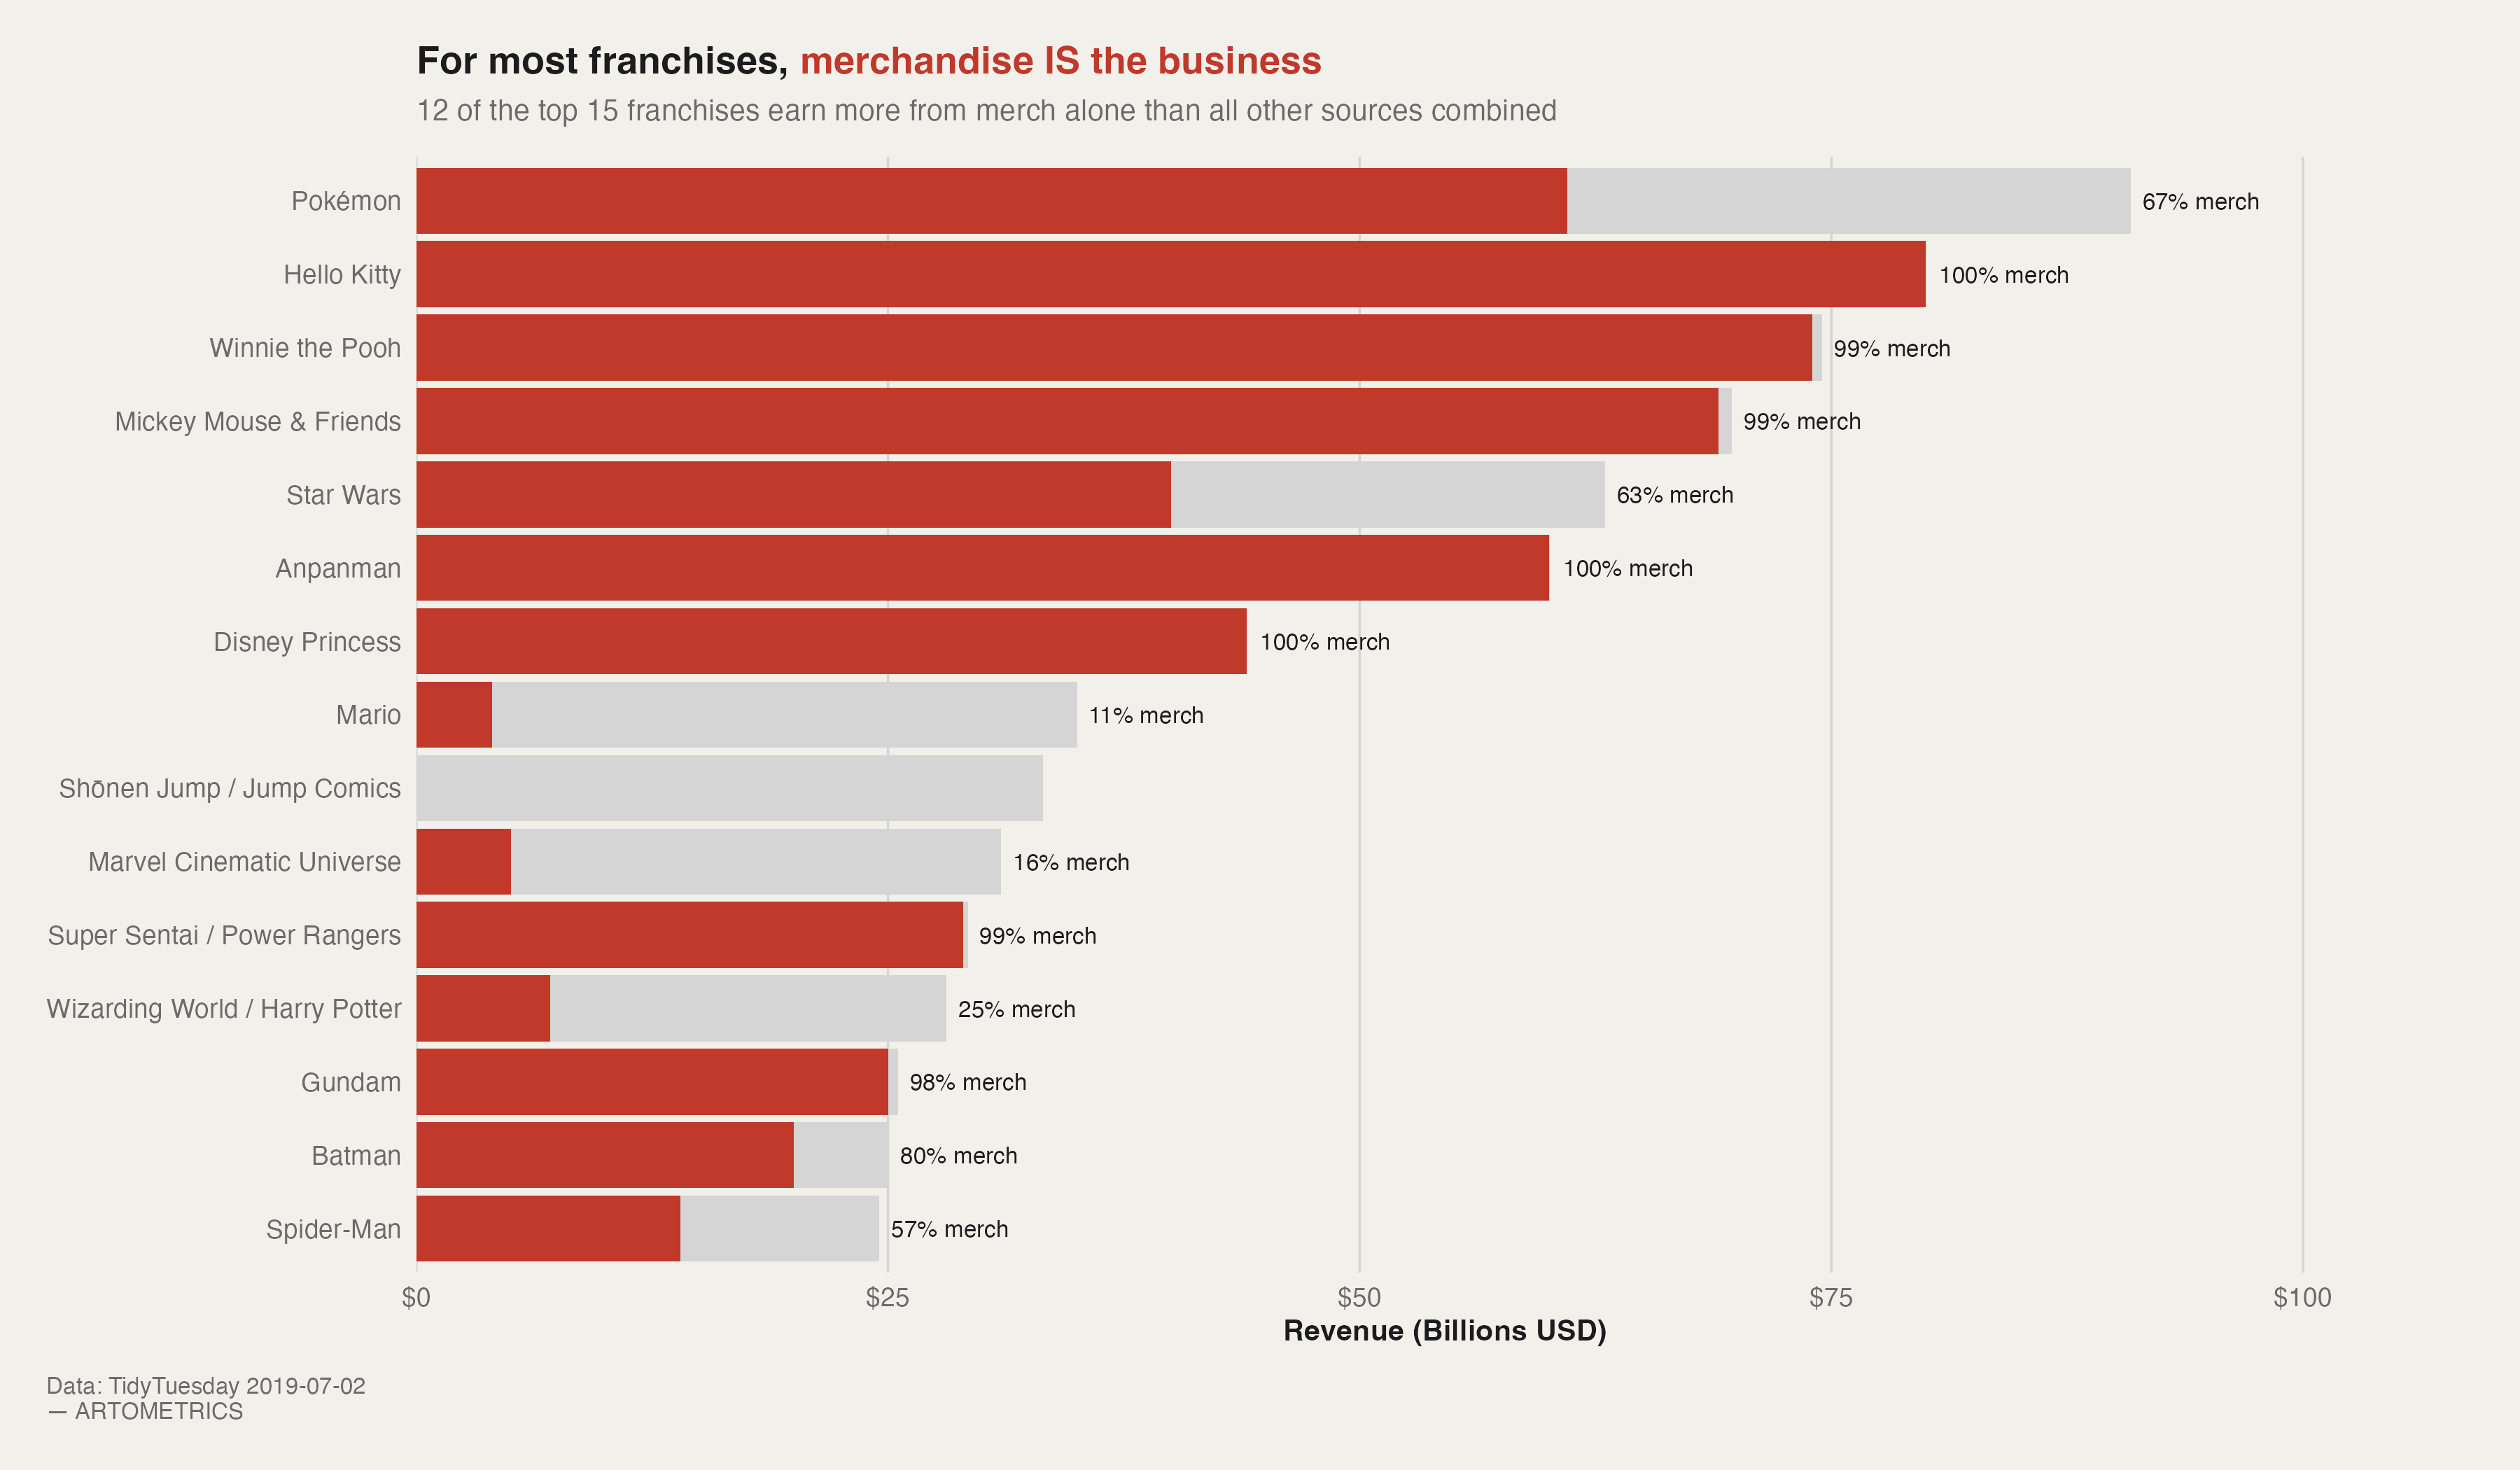
This chart asks a binary question: for each franchise, how much revenue comes from merchandise, and how much from everything else combined? The answer, for most of the top 15, is that merchandise is not a revenue stream — it is the entire business model. The content exists to establish and sustain the characters. The characters exist to be licensed. The licenses generate the revenue. When you understand that hierarchy, the red-dominant pattern in Chart 1 stops being surprising and starts being inevitable. The entertainment industry, at its most commercially scaled, is a licensing industry that uses storytelling as its primary marketing channel.
Three franchises report merchandise percentages at or above 99%, and each represents a distinct archetype of the same underlying model. Hello Kitty is the purest case: a character with no story whatsoever. Sanrio designed it explicitly to be a blank canvas that buyers project personality onto, which makes it infinitely adaptable across every product category and cultural market globally. Winnie the Pooh is a literary character who was almost immediately consumed by its own merchandise machine — A.A. Milne's heirs sold the Disney rights in 1961, and Disney subsequently built one of the most comprehensive licensing operations in retail history around a bear in a red shirt. Mickey Mouse is the origin point of the Disney licensing model itself: Walt Disney licensed Mickey onto a pencil tablet in 1929, one year after Steamboat Willie, because the studio needed cash and the character was already generating demand. That decision effectively invented the modern franchise merchandise model.
Pokémon's merchandise share of approximately 67% is the lowest of the character-driven franchises in this chart — and paradoxically, that is a sign of its scale rather than its diversification. The 33% of revenue coming from non-merchandise sources represents the Pokémon video game series and the trading card game, both of which are multi-billion-dollar industries in their own right. Pokémon is 67% merch not because merch underperforms, but because its other revenue streams are large enough to bring the percentage down. At $91B total, the roughly $30B in non-merchandise revenue is more than the entire lifetime revenue of Batman or Spider-Man.
Mario (11% merch), Marvel Cinematic Universe (16% merch), and Wizarding World / Harry Potter (25% merch) are the three franchises in the top 15 where a majority of revenue comes from non-merchandise sources. Mario's low merch percentage reflects Nintendo's deliberate strategy of keeping the IP tightly coupled to its own hardware and software ecosystem rather than flooding the license market. The MCU's 16% reflects a franchise that earns primarily through box office and home video, with merchandise as a secondary stream rather than the primary one. And Harry Potter's 25% reflects a franchise with an exceptionally strong book sales and box office base — J.K. Rowling's novels generated multi-billion-dollar publishing revenue before a single piece of merchandise was sold. These three are the exceptions that prove the rule: genuine revenue diversification is rare at this scale, and when it exists, it typically traces back to an unusually strong non-merchandise origin.
Shōnen Jump / Jump Comics shows no visible red bar on this chart, which means its merchandise revenue is low enough to be negligible relative to its total. This is worth naming explicitly because Jump is the publisher of Dragon Ball, Naruto, One Piece, Bleach, and Hunter x Hunter — among the most culturally impactful manga franchises in history. The revenue tracked here for Jump is primarily Comic or Manga (publishing). The enormous merchandise markets that exist around Dragon Ball or Naruto are tracked under their individual franchise entries, not under the Jump umbrella. This is a data architecture point rather than an economic one — Jump's publishing revenue is real and substantial — but it illustrates how aggregation choices shape what a chart shows.
A franchise that earns 99% of its revenue from merchandise is extraordinarily powerful when licensing markets are healthy — and extraordinarily exposed when they aren't. Merchandise revenue is sensitive to retail distribution shifts, consumer taste changes, supply chain disruptions, and the cultural relevance cycles that determine whether a character still moves product on a store shelf. The franchises with diversified revenue — Star Wars, the MCU, Harry Potter — have more structural resilience because a box office disappointment doesn't collapse the entire revenue stack. The franchises that are 99% merch have higher peak revenue potential but fewer places to fall back on when cultural momentum shifts. This is the trade-off the chart is quietly showing.
Revenue Category by Original Media Type (Heatmap)
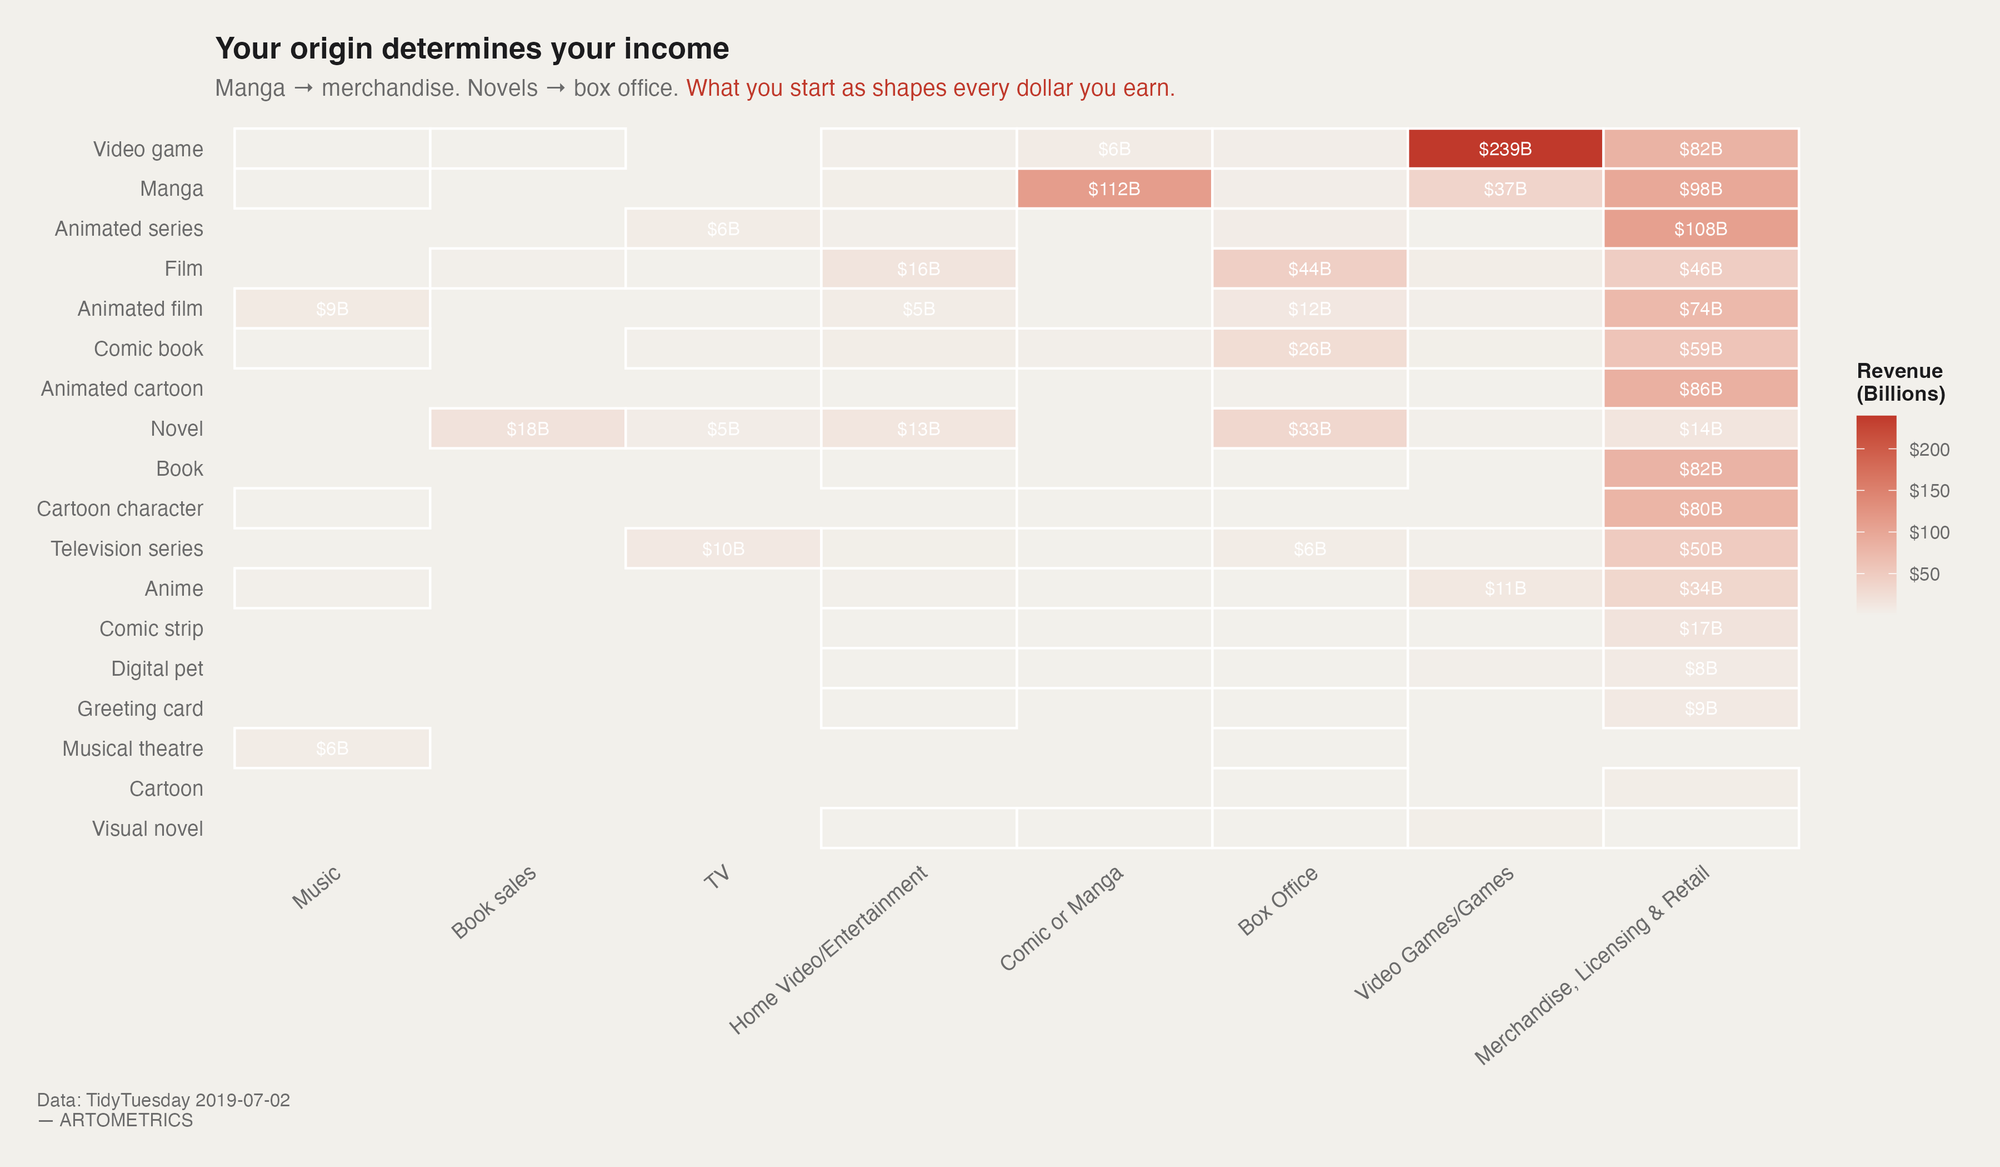
The heatmap makes a structural argument: the medium a franchise starts in is the primary predictor of where its revenue comes from. This is not a coincidence of data aggregation. It is a reflection of how audience relationships form, how licensing markets develop, and how distribution channels compound over time. A franchise that starts as a manga builds its audience through reading, cultivates the kind of devoted fandom that buys character products, and enters a merchandise pipeline that has been refined over decades of Japanese pop culture publishing. A franchise that starts as a novel builds its audience through prose, generates demand for screen adaptations, and monetizes through box office and home video. The starting point creates the trajectory. The trajectory creates the revenue mix.
The Manga row has its darkest cell in the Merchandise, Licensing & Retail column at $112B — the highest merchandise total of any origin category in the dataset. This figure is driven by the franchises that originated in Weekly Shōnen Jump and its competitors: Dragon Ball, Naruto, One Piece, Bleach, Fullmetal Alchemist, and dozens of others that built multi-decade merchandise ecosystems around beloved characters. The manga-to-merchandise pipeline is structurally similar to the character IP model that Hello Kitty and Winnie the Pooh use, but arrives through a different channel: instead of building a blank canvas character, manga builds complex narrative universes that generate intense fan attachment — and then monetizes that attachment through character product, figures, clothing, and collectibles. The output is the same. The cultural pathway is different.
The Video game row has the darkest single cell in the entire heatmap: $239B in Video Games/Games revenue. This is almost entirely Pokémon. Because Pokémon is classified as a video-game-origin franchise and generates roughly $90B in video game revenue on its own, it dominates the row. But the video game origin row also shows meaningful merchandise revenue ($82B) — again, heavily Pokémon — and essentially nothing in box office or book sales. The interpretation: franchises that start as interactive software tend to earn through interactive software and merchandise, and they rarely convert that audience into theatrical or literary revenue at scale. The medium shapes the monetization.
The Novel row is the most interesting counter-pattern. It shows meaningful revenue in Book sales ($18B), TV ($5B), and Home Video/Entertainment ($13B) — but its most striking column is Box Office ($33B). No other origin category generates comparable box office revenue except Film. This reflects the consistent Hollywood appetite for literary IP as source material: the Wizarding World, Twilight, The Hunger Games, and the James Bond franchise (Ian Fleming's novels) all began as prose and monetized primarily through theatrical adaptation. The novel-to-box-office pipeline is one of the most established in the entertainment industry, and this heatmap shows its financial footprint clearly.
Animated film franchises show the most even revenue distribution across columns in the heatmap, with meaningful values in Home Video/Entertainment ($12B), Box Office ($5B), and Merchandise ($74B). This is the Disney and Pixar signature: theatrical release generates awareness and cultural currency, home video extends the revenue window (and historically represented enormous licensing fees), and merchandise converts both into a sustained retail business. The balance in this row is not an accident — it is the output of Disney's vertically integrated franchise model, which was designed specifically to extract revenue from multiple windows rather than betting on a single channel.
Given that anime is a major cultural export and the subject of an entire Artometrics report, the Anime row in this chart is notably thin. Merchandise revenue of $11B and a small video game contribution are the only visible cells. This reflects a dataset design choice rather than an economic reality: most franchises that originated as anime — Gundam, Dragon Ball's anime continuation, Sailor Moon, Pretty Cure — are classified under their original media (manga, TV series, toy line) rather than under "Anime" as an origin. The row here captures IP that is genuinely anime-first with no prior source medium, which is a much smaller category than "franchises that have an anime component."
The blank (near-white) cells in the heatmap are as informative as the dark ones. A blank cell means that origin type essentially never generates revenue in that category — not that no franchise has ever crossed over, but that the total is small enough to register as close to zero against the scales of the visible cells. Novel franchises generate almost no video game revenue. Cartoon character IP generates almost no box office revenue. Greeting card origins (Hello Kitty) generate almost no book sales. These are not gaps waiting to be filled — they are structural limits of what each medium's audience relationship makes commercially viable. The map of blank cells is a map of where franchise expansion does not successfully transfer audience loyalty into new revenue.
Do Older Franchises Make More Money?
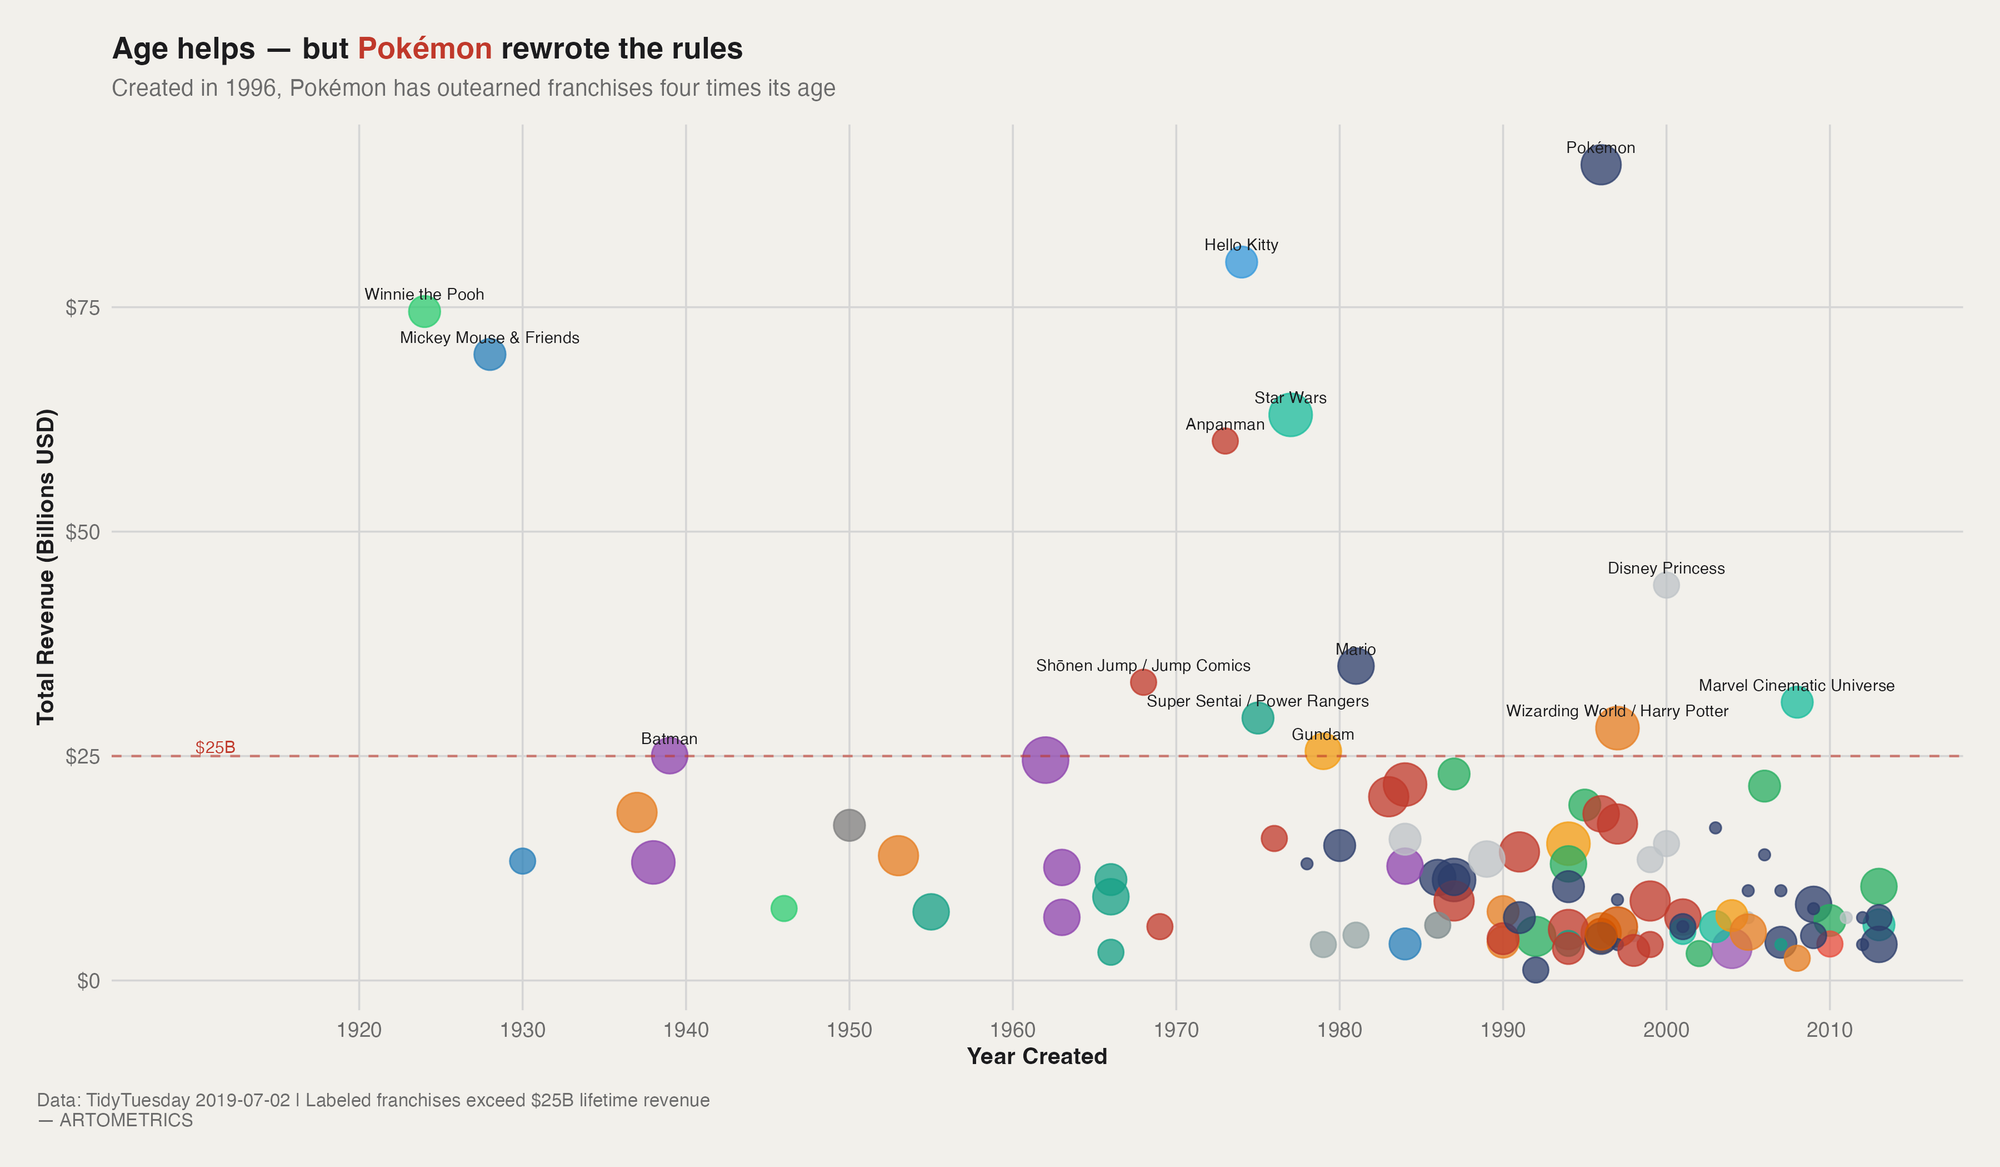
The broad pattern is real and intuitive: older franchises tend to have higher total revenue. This is not a profound insight on its own — more time means more years of product sales, licensing agreements, compounding brand recognition, and sequential audience generations. The upper-left quadrant of this chart (old franchises, high revenue) is where the juggernauts cluster, and the lower-right (newer franchises, lower revenue) is where the recent entrants are still building. But this baseline pattern is precisely what makes the exceptions visible and interesting. The general rule sets the expectation that Pokémon violates.
The upper-left portion of the chart — franchises created before 1980 that have broken $25B in lifetime revenue — contains Winnie the Pooh (1923), Mickey Mouse & Friends (1928), Hello Kitty (1974), Star Wars (1977), and Anpanman (1973). What unites them is not just age but character durability: each is built around an IP that has maintained meaningful cultural relevance across multiple generations of audiences without requiring narrative continuity. You don't need to have seen Bambi to want a Mickey Mouse hat. You don't need to have read the original books to buy a Winnie the Pooh plush. The characters sustain demand independently of the stories — which is the prerequisite for the kind of multi-decade merchandise compounding that produces $70B+ totals.
Pokémon — created in 1996 and sitting at $91B — is the single largest deviation from the age-revenue relationship in this dataset. It has outearned franchises that are two, three, and four times its age. Understanding why requires looking at what Pokémon was structurally designed to do: generate collecting behavior at scale, across every age cohort, continuously. The trading card game creates perpetual demand for new product releases. The video games create new entry points every generation of Nintendo hardware. The anime creates persistent cultural exposure for characters that drive card and game sales. Each component feeds the others in a loop that doesn't require any single cultural moment to sustain — it just requires the system to keep running. Pokémon is an economic machine built inside an entertainment property.
The size of each dot encodes the number of revenue categories that franchise has been tracked across — larger dots have more diversified revenue streams. The biggest dots in the upper portion of the chart (Pokémon, Star Wars, Mario, Wizarding World) are the most diversified franchises and tend to be the highest earners. This is not a coincidence. Revenue diversification and total revenue scale are correlated: franchises that successfully extend into multiple categories tend to reach higher absolute totals, and franchises that reach higher totals tend to have the brand equity necessary to extend into multiple categories. The causality runs in both directions — scale enables diversification, and diversification protects and extends scale.
The lower-right quadrant — franchises created after 1990 with revenue below $25B — is the most densely populated region of the chart. This is where the majority of the dataset lives: properties created in the last 30 years that have cleared the $4B threshold but haven't broken into the upper tier. The density of this region is partly a cohort effect (more franchises have been created in recent decades than in earlier ones) and partly a reflection of the time required to compound. Most of these properties are still in their growth phase by 2019. Some will eventually migrate to higher revenue territory. Most will plateau where they are. The chart shows the density of the field below the $25B line, but it cannot show which properties will eventually clear it.
This chart implies something uncomfortable for anyone building new IP in the 2010s: the structural advantages of age are real, the ceiling for rapid ascent is high, and Pokémon is the exception, not the template. Creating a franchise that reaches $25B+ within 25 years of launch requires either a fundamentally new market (which Pokémon partially benefited from in the early internet era) or a level of cross-category execution that virtually no IP development team has successfully replicated. The franchises most likely to break through are the ones that, like Pokémon, embed a behavioral loop — collecting, competing, trading, sharing — rather than relying on passive consumption alone. Passive consumption makes fans. Behavioral loops make economies.
This dataset reflects revenue estimates compiled from Wikipedia as of mid-2019 and carries several important caveats. Revenue figures are sourced inconsistently — some represent lifetime totals through 2019; others may reflect different windows or methodologies. Franchises are only included if they surpassed an estimated $4B threshold, meaning smaller but culturally significant IP is absent entirely. The ownership and creator fields reflect the state of the industry at the time of data collection and do not account for subsequent acquisitions — for example, the full integration of Fox assets into Disney's portfolio, or the ongoing consolidation of gaming IP by major publishers. Revenue categories were consolidated from over 60 raw Wikipedia subcategories into 8 groups, which involves judgment calls documented in the original TidyTuesday cleaning script. The "Merchandise, Licensing & Retail" category is particularly broad and may include revenue streams that other analyses would track separately. All revenue figures should be treated as order-of-magnitude approximations rather than precise financial data.
The media franchise landscape is not flat — it is sharply skewed toward a small number of IP that have mastered merchandise and sustained it across decades. Pokémon stands alone at the top, not because of box office dominance but because it turned a video game into the world's most successful licensing machine while simultaneously running an anime, a card game, a stadium tour, and a global trading ecosystem. The Artometrics takeaway from this dataset is a single structural insight: the most valuable thing a franchise can do is give people something to own, collect, and trade — not just something to watch.
The franchises that figured this out earliest and most completely — Hello Kitty, Mickey Mouse, Winnie the Pooh — have sustained half-century revenue streams that newer IP can only aspire to. But Pokémon proved the model can be replicated at speed, at scale, and without a century of compounding time. The question for the next generation of IP is not whether to merchandise. Every major franchise already knows the answer to that. The question is whether the underlying IP can generate the kind of behavioral engagement — collecting, competing, trading, playing — that sustains merchandise demand without a continuous hit of new content to power it. The franchises that can do that don't just make money. They become institutions.
HOW WE MADE THE REPORT WITH CLAUDE AI
PLEASE REACH OUT ANYTIME