FRANCHISE: The Artometrics of Media Monopolies
A data analysis of 107 franchises mapping how the most valuable IP in history — from Pokémon to Star Wars — actually makes its money.

A data analysis of 107 franchises mapping how the most valuable IP in history — from Pokémon to Star Wars — actually makes its money.
The TidyTuesday 2019 media franchises dataset covers 107 properties that have each cleared at least $4 billion in estimated lifetime revenue as of mid-2019, sourced from Wikipedia's list of highest-grossing media franchises. This report maps where that money actually comes from, which franchises are the most efficient earners relative to their age, and what the ownership landscape looks like once you collapse Disney's subsidiaries into a single consolidated number.
The answer to all three questions is the same company.
The TidyTuesday 2019 media franchises dataset covers 107 properties, each with at least $4B in estimated lifetime revenue as of mid-2019. The figures are sourced from Wikipedia's list of highest-grossing media franchises and compiled into eight revenue categories. Every franchise here has already cleared a threshold that most IP never approaches — this is not a representative sample of the media industry. It is a map of its ceiling.
The $4B minimum is not a small number. Most films, shows, games, and books that have ever existed never come close to it. Being in this dataset means a property has sustained commercial relevance across multiple revenue streams, often across multiple decades. The franchises below that line — culturally significant, critically acclaimed, beloved — simply aren't here. What remains is the top tier: IP that didn't just succeed but compounded.
Revenue here is a lifetime estimate, not an annual figure. A franchise created in 1923 has had a century to accumulate; one created in 2013 has had six years. That asymmetry shapes every chart. Chart 1 shows the raw totals and what they're made of. Chart 2 corrects for age by normalizing revenue per year — a fairer fight. Chart 3 strips away the ownership labels and asks what the leaderboard actually looks like when subsidiaries are folded into their parent companies.
The owners column names the entity holding the IP rights as of 2019. What it doesn't do is automatically consolidate subsidiaries under parent companies. Disney owns Marvel Entertainment and 20th Century Fox, but all three appear as separate rows in the raw data. Chart 3 exists because of this gap — it asks what the ownership picture looks like when you close it.
-- MEDIA FRANCHISES: CLEANING AND FRANCHISE-LEVEL AGGREGATION
-- Mirrors the R cleaning logic in franchise.qmd
-- Source: TidyTuesday 2019-07-02 (Wikipedia via rfordatascience)

-- ── STEP 1: FRANCHISE-LEVEL SUMMARY ──────────────────────────────
SELECT
    franchise, original_media, year_created, creators, owners,
    COUNT(revenue_category)       AS categories,
    ROUND(SUM(revenue), 2)        AS total_revenue,
    ROUND(2019 - year_created, 0) AS years_active,
    ROUND(SUM(revenue) / NULLIF((2019 - year_created), 0), 4) AS revenue_per_year
FROM media_franchises
GROUP BY franchise, original_media, year_created, creators, owners
ORDER BY total_revenue DESC;

-- ── STEP 2: TOP 20 BY TOTAL REVENUE ──────────────────────────────
SELECT franchise, original_media, year_created, owners,
    ROUND(SUM(revenue), 2) AS total_revenue
FROM media_franchises
GROUP BY franchise, original_media, year_created, owners
ORDER BY total_revenue DESC
LIMIT 20;

-- ── STEP 3: DISNEY CONSOLIDATION ─────────────────────────────────
SELECT
    CASE WHEN owners LIKE '%Walt Disney%'
         THEN 'The Walt Disney Company (consolidated)'
         ELSE owners
    END                       AS parent_company,
    COUNT(DISTINCT franchise) AS franchises_owned,
    ROUND(SUM(revenue), 2)    AS total_revenue
FROM media_franchises
GROUP BY parent_company
HAVING COUNT(DISTINCT franchise) >= 2
ORDER BY total_revenue DESC
LIMIT 12;
import pandas as pd
import numpy as np
import requests
from io import StringIO

url = (
    "https://raw.githubusercontent.com/rfordatascience/tidytuesday/"
    "main/data/2019/2019-07-02/media_franchises.csv"
)
df = pd.read_csv(StringIO(requests.get(url).text))

print(f"Shape: {df.shape[0]:,} rows x {df.shape[1]} columns")
print(f"Columns: {list(df.columns)}")

missing = df.isnull().sum()
print(missing[missing > 0] if missing.sum() > 0 else "No missing values")

print(df["revenue"].describe().round(2))

top5 = df.groupby("franchise")["revenue"].sum().sort_values(ascending=False).head(5).round(1)
print(top5.to_string())

by_cat = df.groupby("revenue_category")["revenue"].sum().sort_values(ascending=False).round(1)
print(by_cat.to_string())

by_media = df.groupby("original_media")["revenue"].agg(["sum","count"]).sort_values("sum", ascending=False).round(1)
by_media.columns = ["total_rev_B", "n_rows"]
print(by_media.to_string())

disney_rows = df[df["owners"].str.contains("Walt Disney", na=False)]
disney_summary = disney_rows.groupby("owners")["revenue"].sum().sort_values(ascending=False).round(1)
print(disney_summary.to_string())
print(f"Disney consolidated total: ${disney_summary.sum():.1f}B")
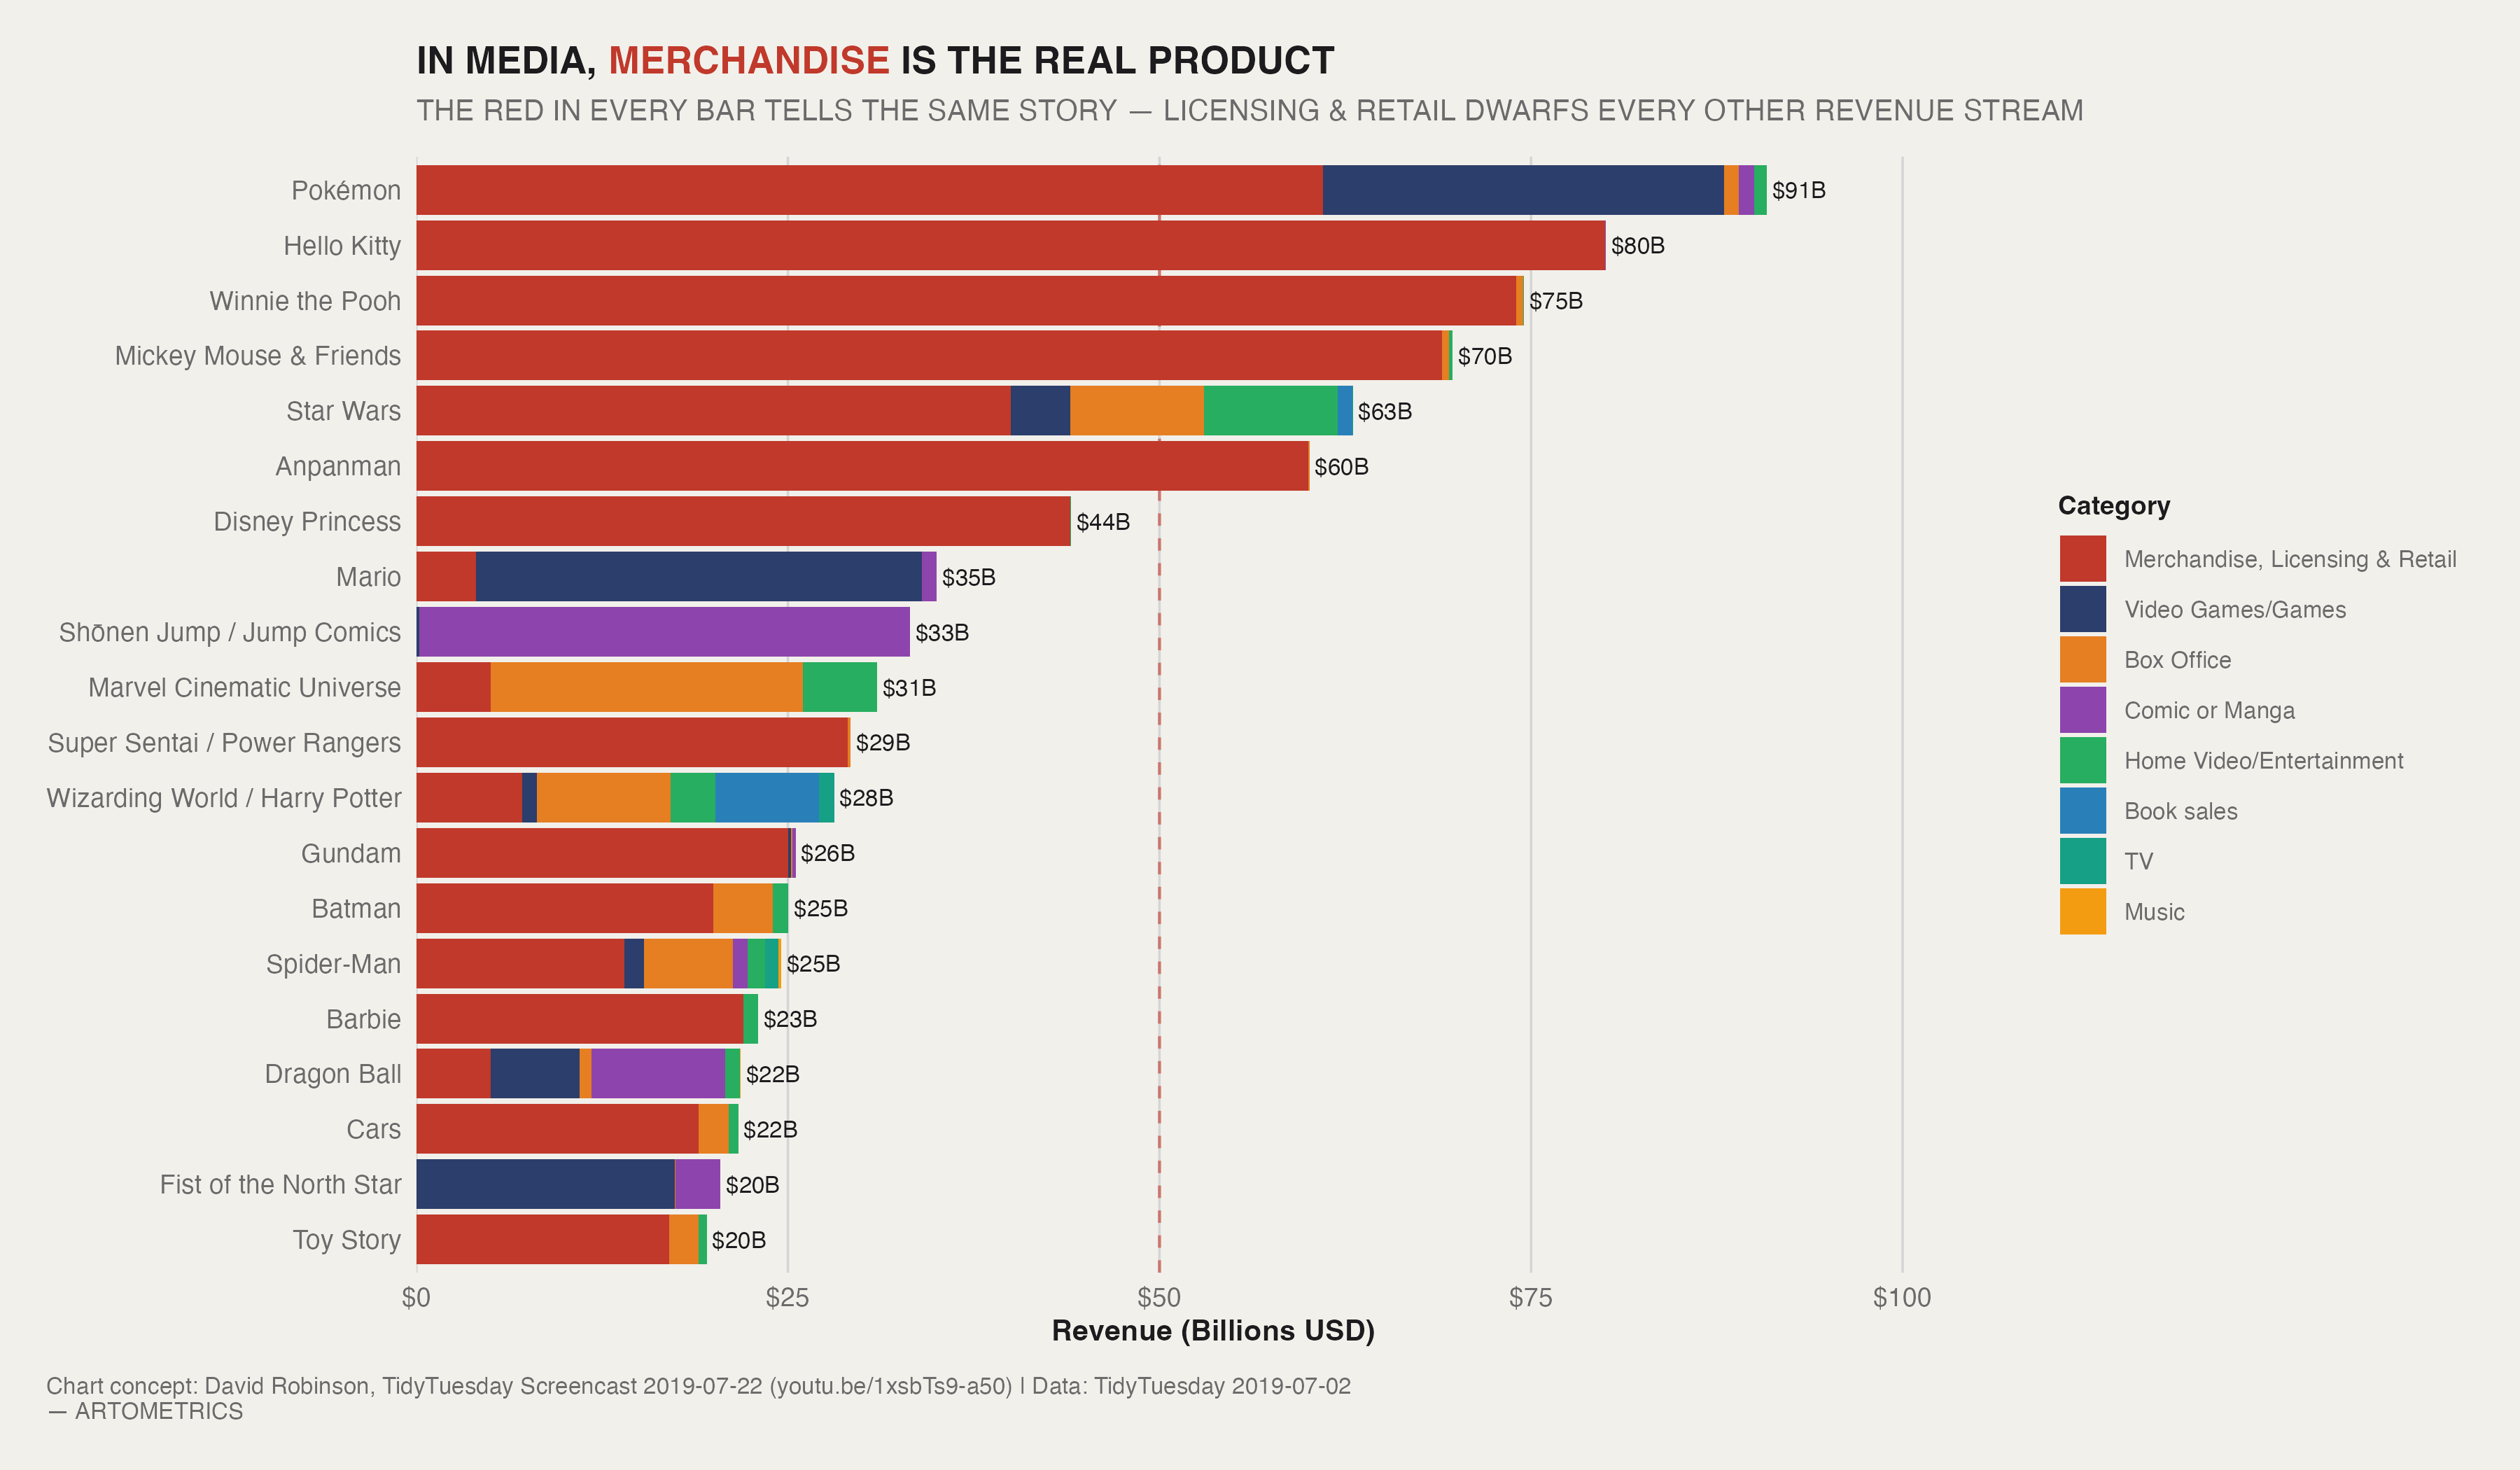
Pokémon at $91B is not just the top of this chart — it is a different kind of number. The gap between Pokémon and second-place Hello Kitty ($80B) is itself larger than the total lifetime revenue of Batman, Spider-Man, or Dragon Ball. This is what it looks like when a franchise achieves structural escape velocity: merchandise revenue compounding over decades, driven by a product line that expands into every available category simultaneously — cards, video games, plush, clothing, themed food, and an anime that has functioned primarily as a 25-year commercial for the card game. Pokémon was not built to be a franchise. It was built to be an economy.
The color logic of this chart is the argument. Merchandise, Licensing & Retail (red) dominates the fill for nearly every bar in the top 20. This is not a quirk of how Wikipedia compiles revenue — it is a structural feature of how large-scale IP actually makes money. The content — films, games, episodes — functions primarily as marketing infrastructure for the real product, which is the license. The entertainment generates demand. Merchandise captures it.
Three franchises break visibly from the red-dominant pattern. Mario is mostly dark blue — Nintendo has spent decades resisting the licensing temptation that Disney and Sanrio embraced fully, keeping the IP tightly coupled to its own hardware ecosystem. Shōnen Jump / Jump Comics is mostly purple (Comic or Manga) because its revenue structure is a publishing business — magazines and tankōbon volumes, not T-shirts. And Star Wars shows the most balanced mix: box office, merchandise, home video, and games each contributing meaningfully. Star Wars is the model of a fully diversified franchise — which is why Disney paid $4B for Lucasfilm in 2012.
category_colors <- c(
  "Merchandise, Licensing & Retail" = "#C0392B",
  "Video Games/Games"               = "#2C3E6B",
  "Box Office"                      = "#E67E22",
  "Home Video/Entertainment"        = "#27AE60",
  "Comic or Manga"                  = "#8E44AD",
  "Music"                           = "#F39C12",
  "TV"                              = "#16A085",
  "Book sales"                      = "#2980B9"
)

top20 <- franchises %>% slice_max(total_revenue, n = 20)

plot_data <- media_franchises %>%
  semi_join(top20, by = "franchise") %>%
  mutate(
    franchise        = fct_reorder(franchise, revenue, sum),
    revenue_category = fct_reorder(revenue_category, revenue, sum)
  )

label_data <- plot_data %>%
  group_by(franchise) %>%
  summarize(total_revenue = sum(revenue), .groups = "drop")

p1 <- ggplot(plot_data, aes(franchise, revenue, fill = revenue_category)) +
  geom_hline(yintercept = 50, color = "#C0392B", linetype = "dashed", linewidth = 0.5, alpha = 0.6) +
  geom_col() +
  geom_text(data = label_data,
    aes(x = franchise, y = total_revenue, label = paste0("$", round(total_revenue, 0), "B")),
    inherit.aes = FALSE, hjust = -0.1, size = 2.8, color = "#1C1C1E") +
  scale_y_continuous(labels = dollar, expand = expansion(mult = c(0, 0.18))) +
  scale_fill_manual(values = category_colors) +
  coord_flip() +
  guides(fill = guide_legend(reverse = TRUE)) +
  theme_artometrics() +
  theme(panel.grid.major.y = element_blank()) +
  labs(
    title    = "IN MEDIA, **MERCHANDISE** IS THE REAL PRODUCT",
    subtitle = "THE RED IN EVERY BAR TELLS THE SAME STORY — LICENSING & RETAIL DWARFS EVERY OTHER REVENUE STREAM",
    x = NULL, y = "Revenue (Billions USD)", fill = "Category",
    caption  = "Chart concept: David Robinson, TidyTuesday Screencast 2019-07-22 | Data: TidyTuesday 2019-07-02\n— ARTOMETRICS"
  )

p1
ggsave("chart1_top20_revenue.png", plot = p1, path = "charts", width = 12, height = 7, dpi = 300, bg = "white")

Total revenue rewards longevity. Revenue per year rewards efficiency. Normalizing by age puts a 1928 franchise and a 1996 franchise on comparable footing — and the resulting ranking surfaces something the raw totals hide. How much value does this franchise generate per year of its existence? The answer reshuffles the leaderboard significantly. Several juggernauts that dominate Chart 1 quietly fall here, while younger, faster-earning properties rise.
Pokémon's $4B/yr is not explained by any single hit. It is explained by a system: the video games create new entry points every hardware generation; the trading card game creates perpetual demand for new product; the anime provides continuous character exposure that drives card and game sales. Each component feeds the others in a loop that doesn't require any single cultural moment to sustain. Pokémon doesn't just earn well — it earns continuously, from multiple directions, at the same time.
Several franchises that ranked very high on total revenue drop here when normalized by time. Hello Kitty ($80B total, second overall) falls to fourth at $1.8B/yr — because it has been generating that revenue since 1974, making 45 years the denominator that brings the rate down. Winnie the Pooh and Mickey Mouse drop further still. Their massive lifetime totals are the product of nearly a century of operation. The per-year lens is unforgiving to age: a franchise that earns $1B/yr for 90 years scores lower on this chart than one earning $2B/yr for 25.
chart2_data <- franchises %>%
  mutate(
    years_active     = 2019 - year_created,
    revenue_per_year = total_revenue / years_active,
    is_top           = as.character(franchise == "Pokémon")
  ) %>%
  slice_max(revenue_per_year, n = 15) %>%
  mutate(franchise = fct_reorder(franchise, revenue_per_year))

p2 <- ggplot(chart2_data, aes(x = franchise, y = revenue_per_year)) +
  geom_hline(yintercept = 2, color = "#C0392B", linetype = "dashed", linewidth = 0.5, alpha = 0.6) +
  geom_segment(aes(xend = franchise, y = 0, yend = revenue_per_year, color = is_top), linewidth = 0.8) +
  geom_point(aes(color = is_top, size = is_top)) +
  geom_text(aes(label = paste0("$", round(revenue_per_year, 1), "B/yr")), hjust = -0.2, size = 3, color = "#1C1C1E") +
  scale_color_manual(values = c("TRUE" = "#C0392B", "FALSE" = "#2C3E6B"), guide = "none") +
  scale_size_manual(values = c("TRUE" = 7, "FALSE" = 4.5), guide = "none") +
  scale_y_continuous(labels = dollar, expand = expansion(mult = c(0, 0.28))) +
  coord_flip() + theme_artometrics() + theme(panel.grid.major.y = element_blank()) +
  labs(
    title    = "POKÉMON EARNS MORE PER YEAR THAN MOST FRANCHISES EARN IN A LIFETIME",
    subtitle = "~$4B ANNUALLY SINCE 1996 — MORE THAN HELLO KITTY, WHICH IS TWICE ITS AGE",
    x = NULL, y = "Revenue Per Year (Billions USD)",
    caption  = "Data: TidyTuesday 2019-07-02 | Revenue ÷ (2019 − year created)\n— ARTOMETRICS"
  )

p2
ggsave("chart2_revenue_per_year.png", plot = p2, path = "charts", width = 12, height = 7, dpi = 300, bg = "white")
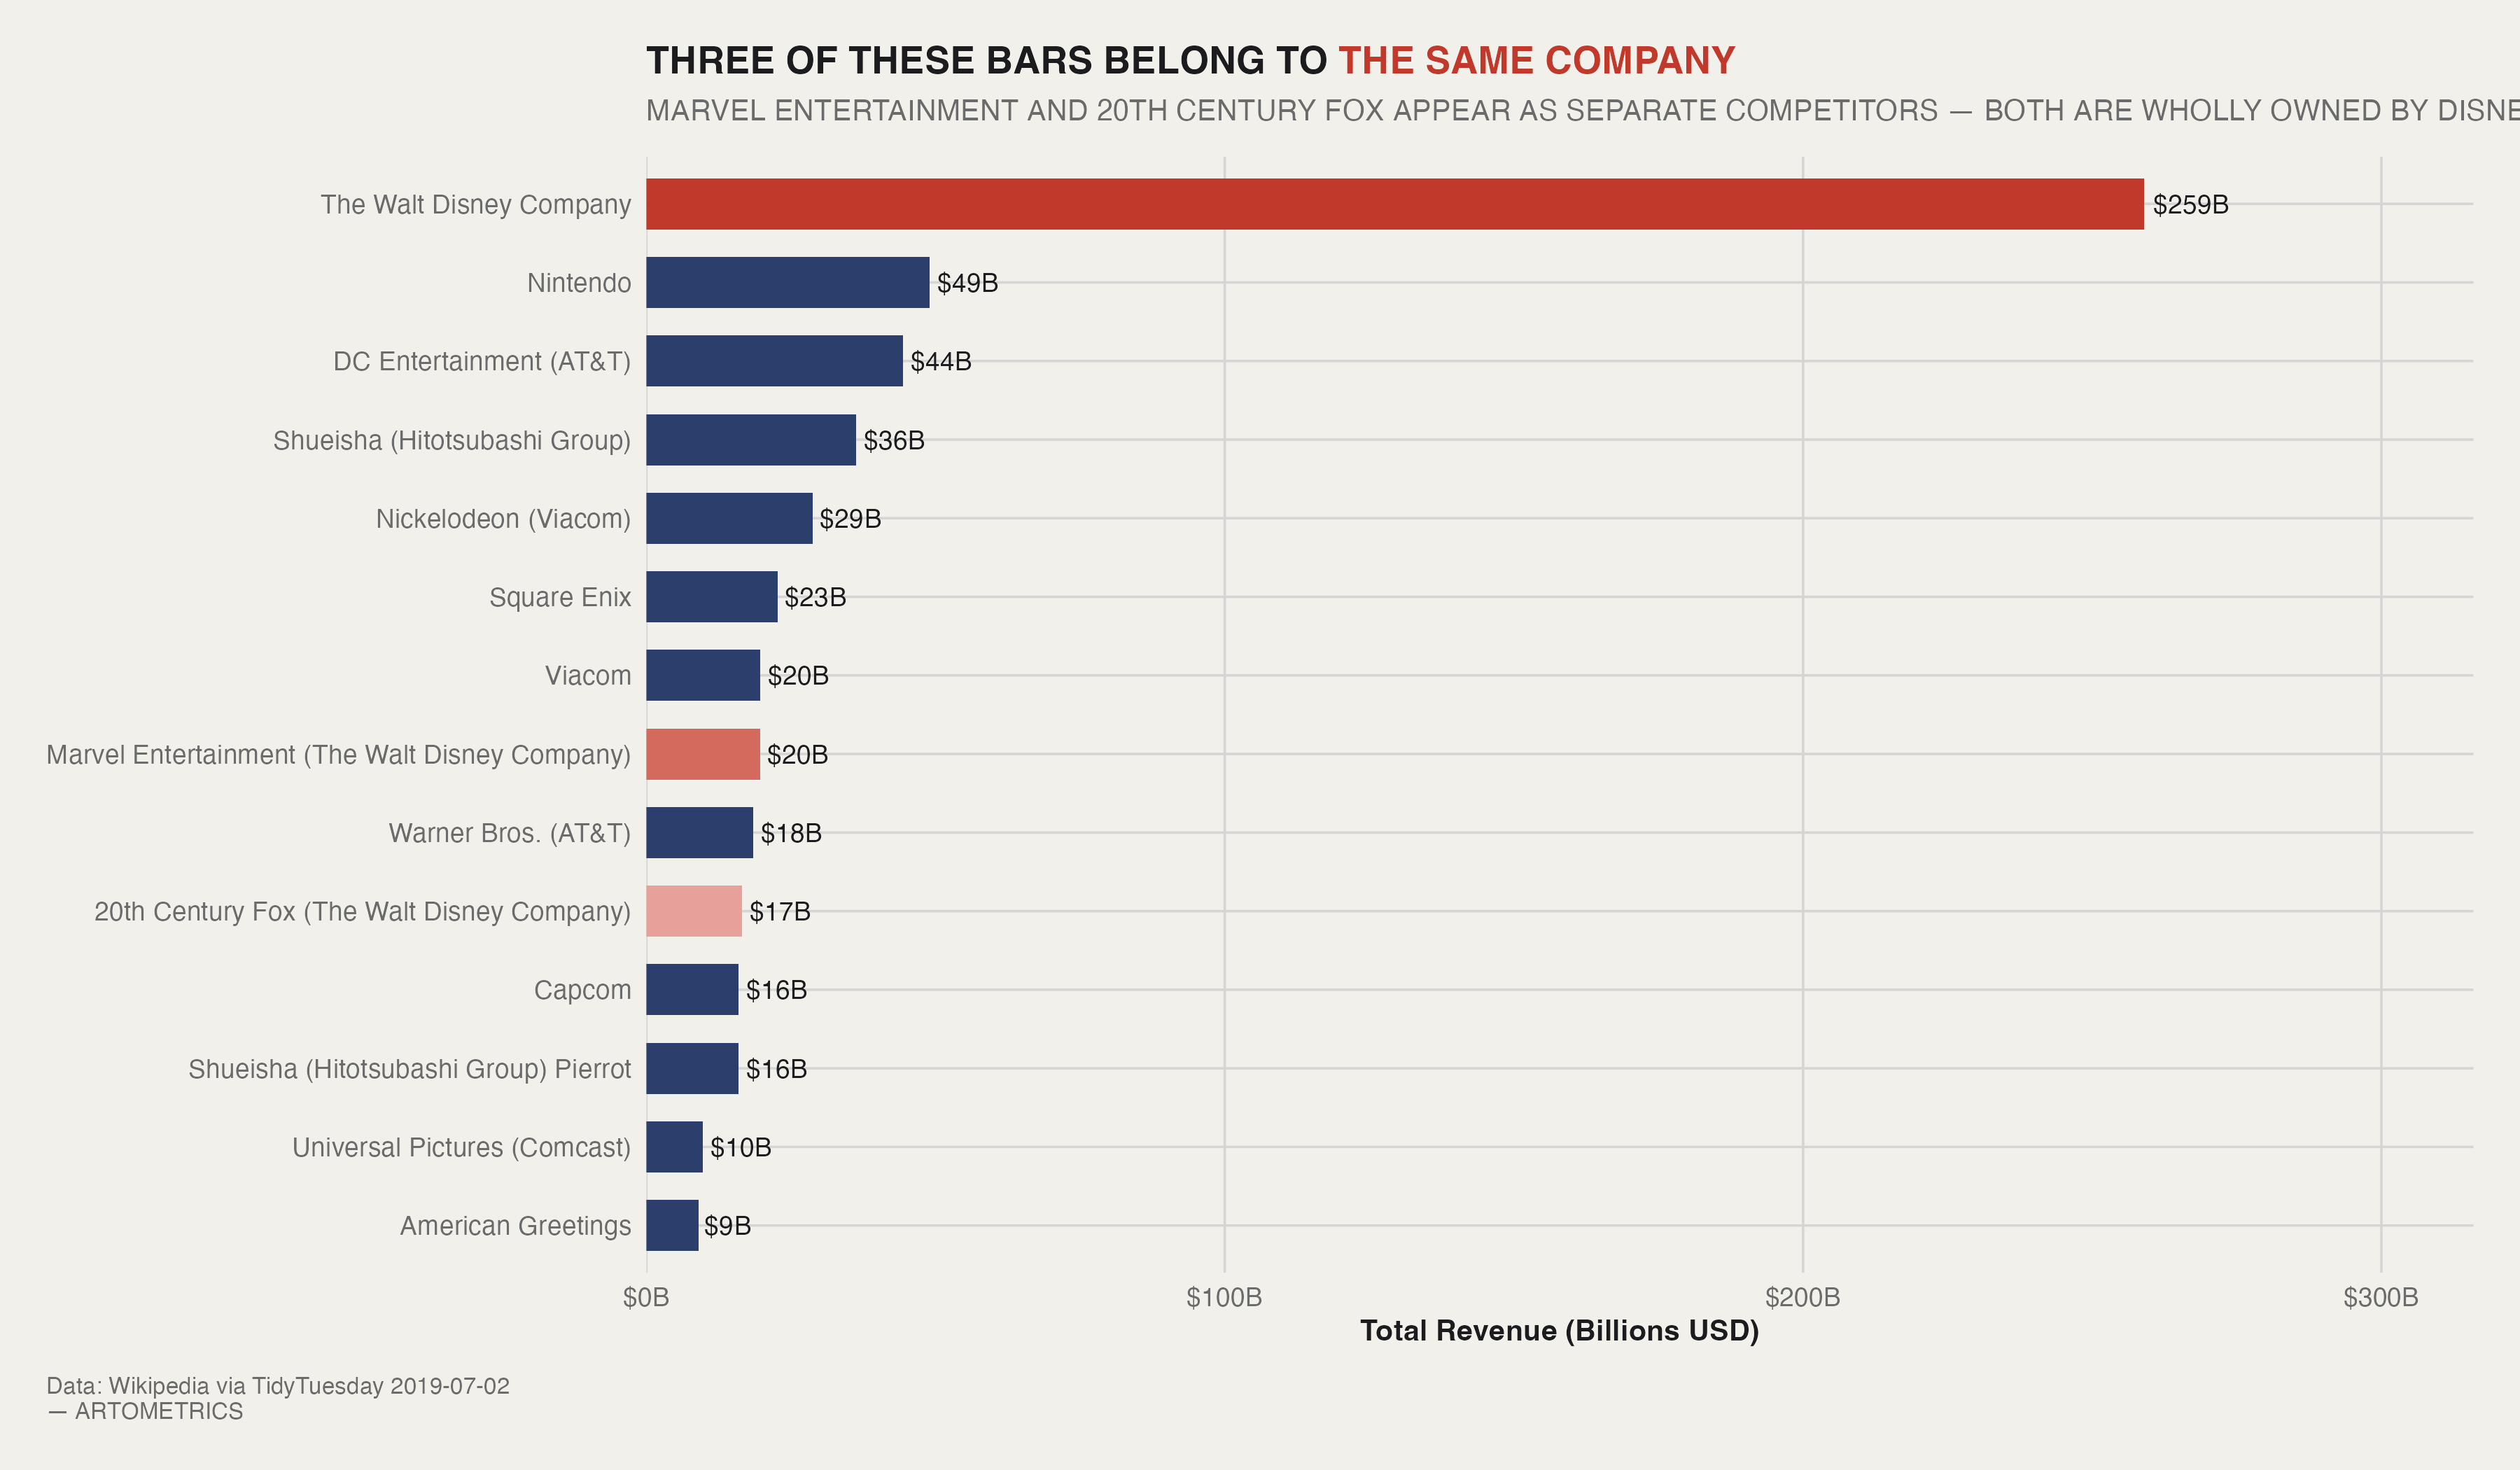
The raw data lists "The Walt Disney Company," "Marvel Entertainment (The Walt Disney Company)," and "20th Century Fox (The Walt Disney Company)" as three separate owners. Technically accurate. Strategically misleading. Marvel was acquired in 2009 for $4B. Fox was acquired in 2019 for $71B. Both are now wholly owned subsidiaries. Their revenue goes to the same place.
This is how corporate IP ownership actually works. You don't buy franchises — you buy the companies that own franchises, and those companies keep operating under their own names. Marvel Studios still greenlit its own films. Fox kept its lot in Century City. But the revenue goes to Burbank.
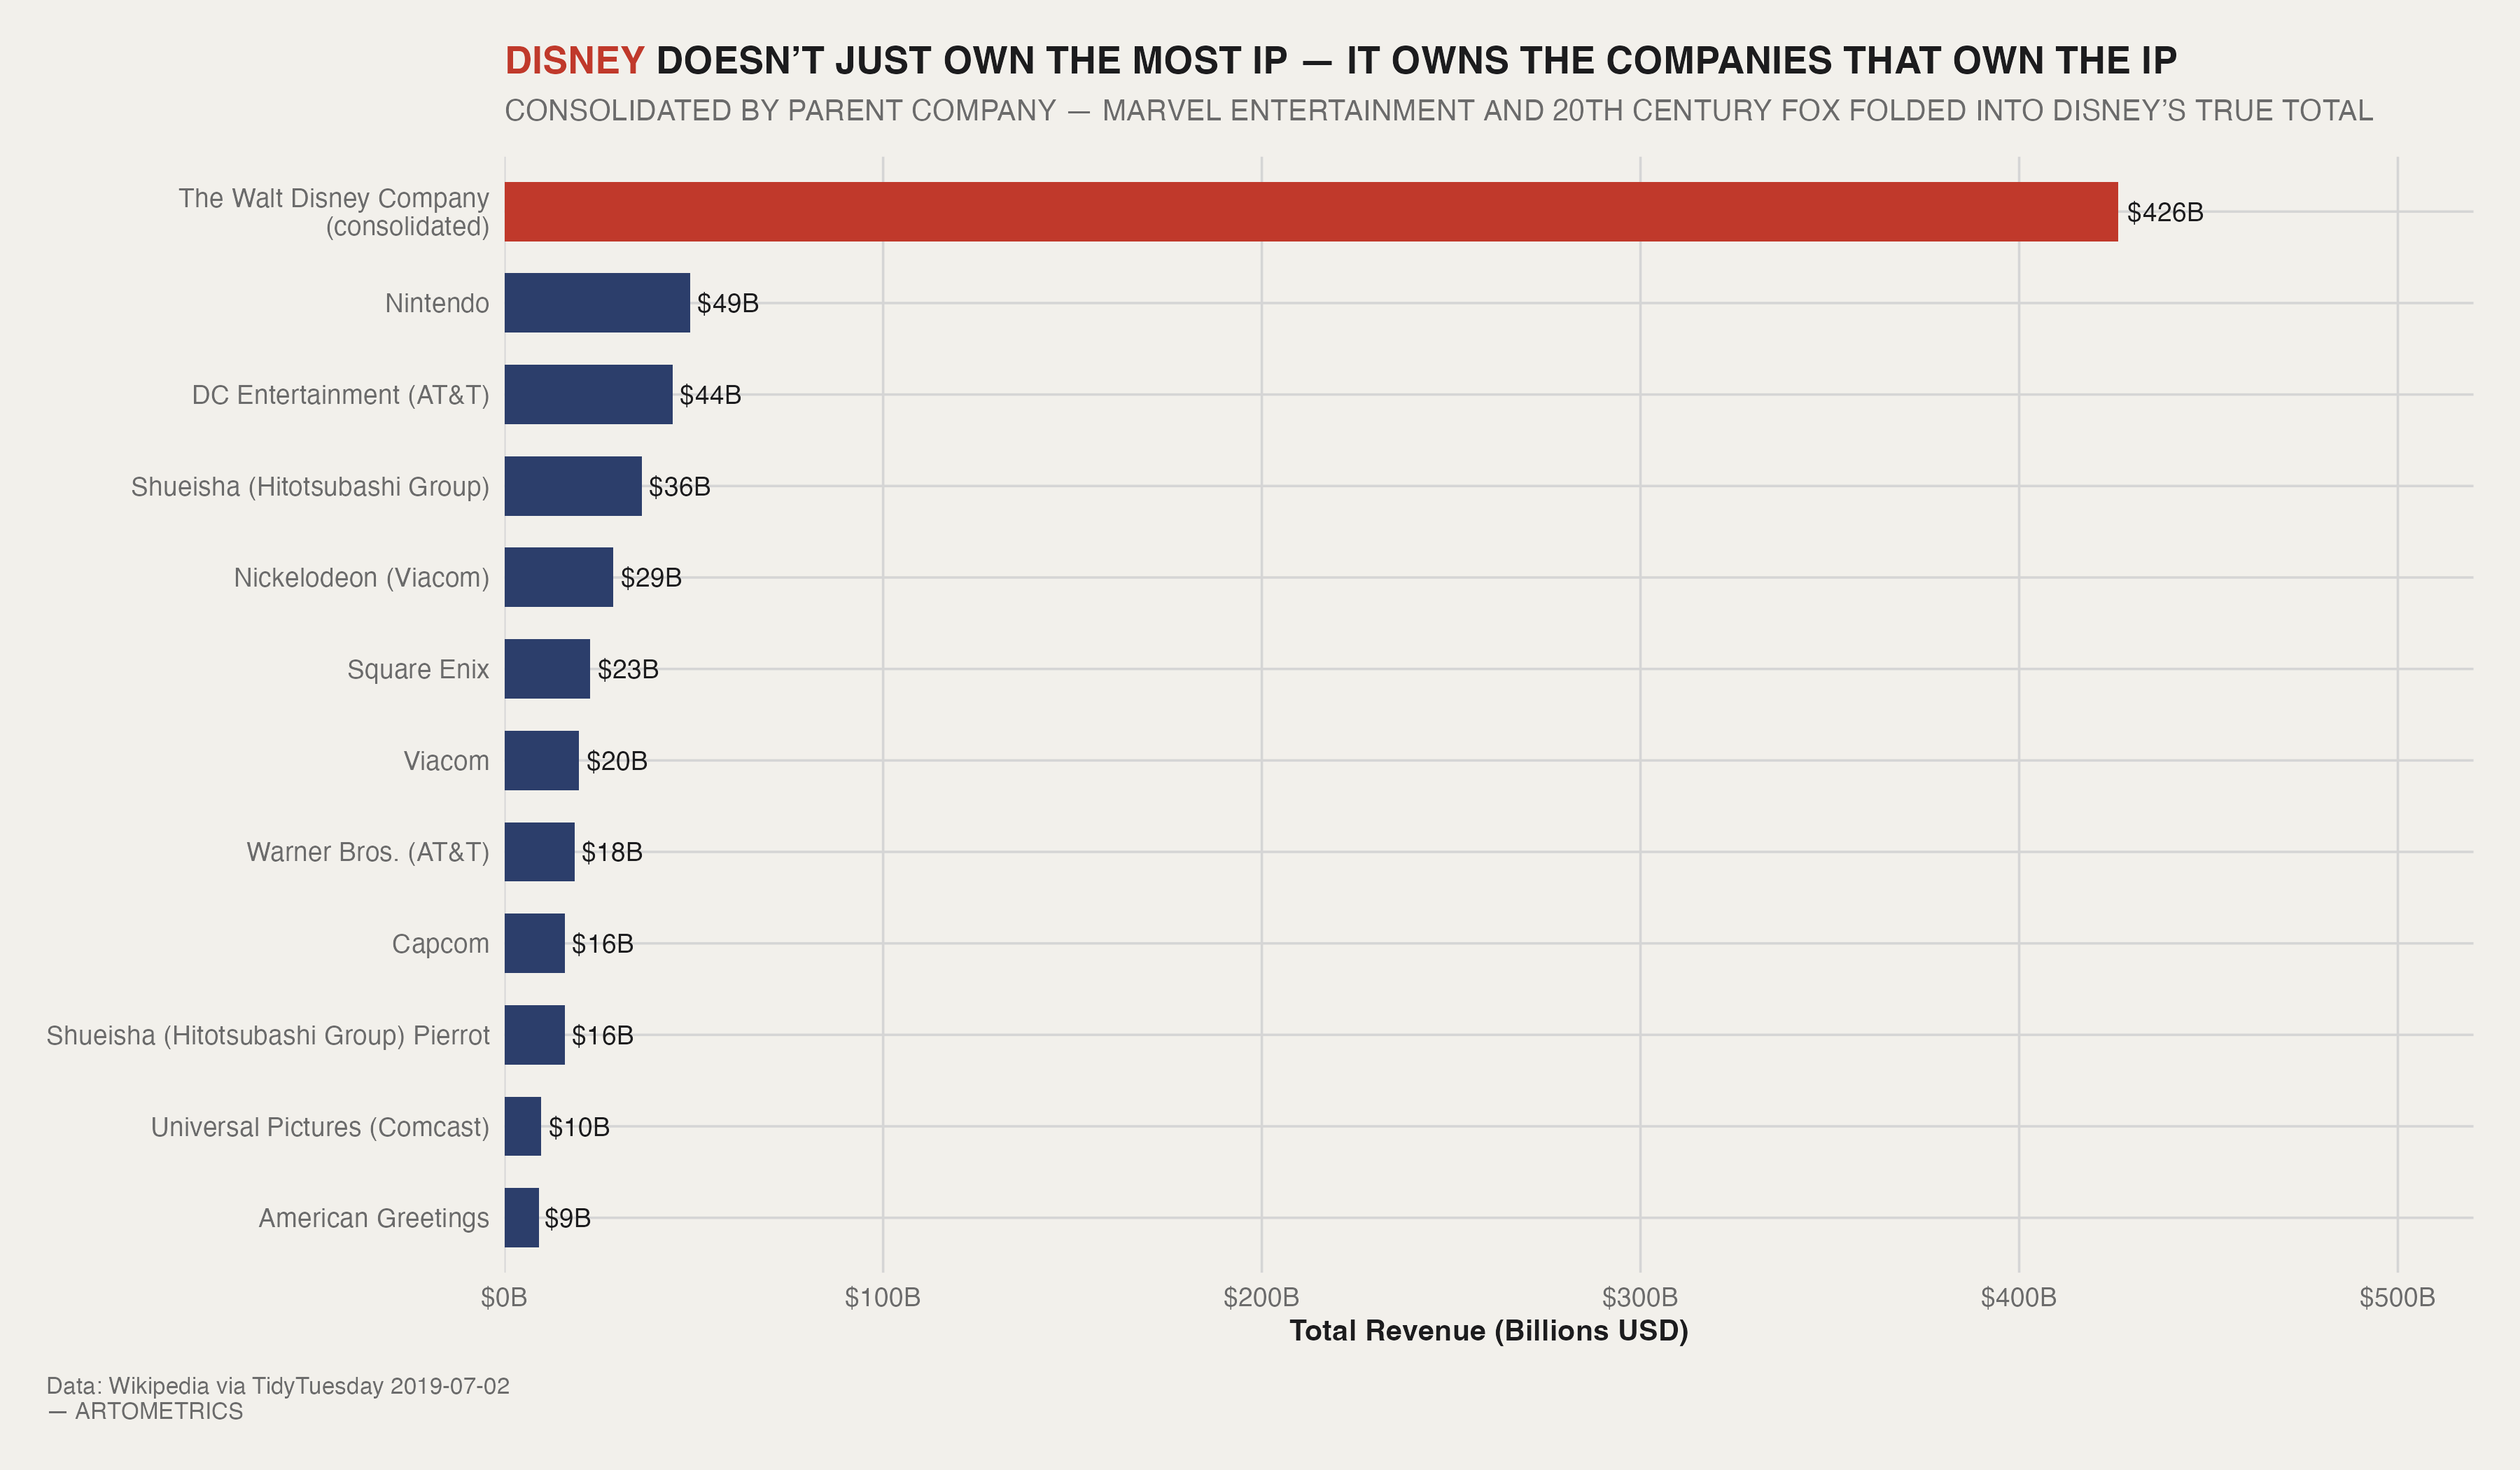
Add them up and Disney's true total is $426 billion. Nintendo at $49B — still second — now represents about 11 cents on Disney's dollar. But here's what the math actually surfaces: Marvel ($20B) plus Fox ($17B) should consolidate to $296B. The remaining $130 billion comes from Disney-owned entities too small to crack the top 14 individually — Pixar, Lucasfilm, ABC, ESPN. Subsidiaries whose franchise rows exist in the dataset but don't rank highly enough to appear as standalone bars. Individually invisible. Collectively, they add up to more than Nintendo's entire lifetime output.
That is the actual scale of the Disney empire. Not one dominant company. Not even three. An ecosystem of wholly-owned studios, publishers, and licensors — some famous, some not — each running their own operations, all consolidating upward to the same balance sheet. The chart makes visible something the raw data quietly obscures: in IP, ownership structure is as strategically important as the franchises themselves. Disney didn't just build great IP. It bought the companies that owned great IP, let them keep their identities, and harvested everything upward.
## ── CHART 3a ─────────────────────────────────────────────────────
non_consolidated <- media_franchises |>
  group_by(owners) |>
  summarise(total_revenue = sum(revenue, na.rm = TRUE), franchises_owned = n_distinct(franchise), .groups = "drop") |>
  filter(franchises_owned >= 2) |>
  slice_max(total_revenue, n = 14) |>
  mutate(
    owners = fct_reorder(owners, total_revenue),
    disney_flag = case_when(
      owners == "The Walt Disney Company"                        ~ "disney_direct",
      owners == "Marvel Entertainment (The Walt Disney Company)" ~ "disney_marvel",
      owners == "20th Century Fox (The Walt Disney Company)"     ~ "disney_fox",
      TRUE ~ "other"
    )
  )

p3a <- ggplot(non_consolidated, aes(x = owners, y = total_revenue, fill = disney_flag)) +
  geom_col(width = 0.65, show.legend = FALSE) +
  geom_text(aes(label = paste0("$", round(total_revenue), "B")), hjust = -0.12, color = "#1C1C1E", size = 3.2) +
  scale_fill_manual(values = c("disney_direct" = "#C0392B", "disney_marvel" = "#D4695E", "disney_fox" = "#E8A09A", "other" = "#2C3E6B")) +
  scale_y_continuous(labels = dollar_format(suffix = "B"), expand = expansion(mult = c(0, 0.22))) +
  coord_flip() + theme_artometrics() + theme(axis.text.y = element_text(size = 9)) +
  labs(
    title = "THREE OF THESE BARS BELONG TO **THE SAME COMPANY**",
    subtitle = "MARVEL ENTERTAINMENT AND 20TH CENTURY FOX APPEAR AS SEPARATE COMPETITORS — BOTH ARE WHOLLY OWNED BY DISNEY",
    x = NULL, y = "Total Revenue (Billions USD)",
    caption = "Data: Wikipedia via TidyTuesday 2019-07-02\n— ARTOMETRICS"
  )
p3a
ggsave("chart3a_disney_non_consolidated.png", plot = p3a, path = "charts", width = 12, height = 7, dpi = 300, bg = "white")

## ── CHART 3b ─────────────────────────────────────────────────────
disney_consolidated <- media_franchises |>
  mutate(parent_company = case_when(str_detect(owners, "Walt Disney") ~ "The Walt Disney Company\n(consolidated)", TRUE ~ owners)) |>
  group_by(parent_company) |>
  summarise(total_revenue = sum(revenue, na.rm = TRUE), franchises_owned = n_distinct(franchise), .groups = "drop") |>
  filter(franchises_owned >= 2) |>
  slice_max(total_revenue, n = 12) |>
  mutate(parent_company = fct_reorder(parent_company, total_revenue), is_disney = str_detect(parent_company, "Walt Disney"))

p3b <- ggplot(disney_consolidated, aes(x = parent_company, y = total_revenue, fill = is_disney)) +
  geom_col(width = 0.65, show.legend = FALSE) +
  geom_text(aes(label = paste0("$", round(total_revenue), "B")), hjust = -0.12, color = "#1C1C1E", size = 3.2) +
  scale_fill_manual(values = c("FALSE" = "#2C3E6B", "TRUE" = "#C0392B")) +
  scale_y_continuous(labels = dollar_format(suffix = "B"), expand = expansion(mult = c(0, 0.22))) +
  coord_flip() + theme_artometrics() + theme(axis.text.y = element_text(size = 9)) +
  labs(
    title = "**DISNEY** DOESN'T JUST OWN THE MOST IP — IT OWNS THE COMPANIES THAT OWN THE IP",
    subtitle = "CONSOLIDATED BY PARENT COMPANY — MARVEL ENTERTAINMENT AND 20TH CENTURY FOX FOLDED INTO DISNEY'S TRUE TOTAL",
    x = NULL, y = "Total Revenue (Billions USD)",
    caption = "Data: Wikipedia via TidyTuesday 2019-07-02\n— ARTOMETRICS"
  )
p3b
ggsave("chart3b_disney_consolidated.png", plot = p3b, path = "charts", width = 12, height = 7, dpi = 300, bg = "white")
This dataset reflects revenue estimates compiled from Wikipedia as of mid-2019, and carries several important caveats. Revenue figures are sourced inconsistently — some represent lifetime totals through 2019, others may reflect different windows or methodologies. Franchises are only included if they surpassed an estimated $4B threshold, meaning smaller but culturally significant IP is absent entirely. The ownership and creator fields reflect the state of the industry at the time of collection and do not account for subsequent acquisitions. Revenue categories were consolidated from over 60 raw Wikipedia subcategories into 8 groups, which involves judgment calls documented in the original TidyTuesday cleaning script. The "Merchandise, Licensing & Retail" category is particularly broad and may include revenue streams that other analyses would track separately. All revenue figures should be treated as order-of-magnitude approximations rather than audited financial data.
The media franchise landscape is not flat — it is sharply skewed toward a small number of IP that have mastered merchandise and sustained it across decades. Pokémon stands alone at the top not because of box office dominance but because it turned a video game into the world's most successful licensing machine while simultaneously running an anime, a card game, and a global trading ecosystem. The Artometrics takeaway from this dataset is a single structural insight: the most valuable thing a franchise can do is give people something to own, collect, and trade — not just something to watch.
Disney's story is a different kind of lesson. The company didn't just build great IP — it systematically acquired the companies that owned great IP and rolled them into a single consolidated empire. The $130B gap between Disney's apparent total and its true total is a number that only becomes visible when you collapse the ownership structure the raw data obscures. That gap, by itself, is larger than Nintendo's entire lifetime output. In IP, what you own is one thing. What your subsidiaries own is another. Disney understood the difference earlier and more completely than anyone.
This report was researched, written, designed, and produced in active collaboration with Claude AI (Anthropic). The data pipeline, statistical analysis, chart design, written analysis, narrative structure, and visual styling were all developed through a directed partnership between human editorial judgment and AI execution. Artometrics was built on the premise that rigorous analysis and honest process are not in conflict. The research questions, editorial instincts, interpretive framing, and brand vision are ours. The execution — every line of R code, every paragraph of analysis, every design decision — was a collaboration. We document this not as a disclaimer but as a description of how we actually work, and as a position: we believe this is what serious data journalism looks like when the tools available are used honestly and at full capacity.
— Artometrics Editorial