CAESAR: The Psychonomics of the Great Dictator

Economics comes from the Greek oikonomia — the management of the house. Psychonomics asks the prior question: who is managing the soul of the house, and what does their inner architecture cost everyone living inside it? Julius Caesar is the founding case study. His policies were not abstract theories. They were his biography, scaled.
Caesar was born in 100 BCE into the Subura — Rome's roughest district — to a patrician family with a noble name and thin wallets. His father died when Caesar was fifteen, leaving him head of household with no resources and no patron. By the time he was twenty-five, Cilician pirates had captured his ship, set a ransom of twenty talents, and watched Caesar laugh, volunteer to pay fifty, spend thirty-eight days as their captive writing poetry and calling them illiterates, then return after his release with a fleet he raised himself and crucify every one of them — exactly as promised. This is not a fun anecdote. It is the earliest behavioral evidence of his core operating theory: the self is the institution. The pattern never changed. The scale did.
By 44 BCE, Caesar had crossed the Rubicon, won a civil war, reformed the debt system, redistributed land to 80,000 veterans and urban poor, rebuilt the calendar, and declared himself dictator for life. He was then stabbed twenty-three times by sixty senators — led by Brutus and Cassius, two men he had personally pardoned, appointed to the praetorship, and promised future consulships. The house he built outlasted him by five centuries. The soul that built it was load-bearing in a way no institution can survive.
This report applies the Leadership Trait Analysis (LTA) framework, developed by political psychologist Margaret Hermann (1999) and used operationally by the CIA's Center for the Analysis of Political Behavior. LTA scores leaders on seven psychological variables by analyzing the content of their speeches and writings: Belief in ability to control events (B), Conceptual complexity (CC), Distrust of others (D), In-group bias (IB), Need for power (P), Need for affiliation (A), and Task orientation (T). Scores are normalized against a reference group of 100+ world leaders profiled between 1945–2010, on a 0–1.0 scale.
Applying LTA to an ancient figure is a legitimate extension of the method — published scholarship has done so for historical leaders using the same coding rubric (see: Dyson, 2006, Political Psychology; Post, 2004, Leaders and Their Followers in a Dangerous World). For Caesar, scores are coded from three primary sources: the Commentarii de Bello Gallico (58–50 BCE, self-authored), Plutarch's Parallel Lives: Caesar (c. AD 100), and Suetonius's Divus Julius (c. AD 121). Comparative scores for Mao, Xi, and Thatcher are drawn from Wang & Guo (2019) and the Hermann (1999) reference baseline.
The Roman GDP per capita series is drawn from Maddison (2007), with revisions by Scheidel & Friesen (2009) and Lo Cascio & Malanima (2011). All values are in 1990 Geary-Khamis (international) dollars — the standard comparative unit for pre-industrial economies. The Maddison Project's earliest reliable Roman anchor is 14 AD; estimates before that date carry wider uncertainty intervals and should be read as directional rather than precise. The uncertainty band on Chart 2 reflects the low-to-high range across published scholarly estimates.
The patronage network in Chart 3 is constructed directly from primary sources — Plutarch, Suetonius, and Strauss (2015). Node trust weights reflect documented appointments, pardons, and written correspondence; they are not computationally derived. Edge types (military loyalty, political appointment, pardoned enemy) are coded from the historical record. This is a qualitative network made structural, not a computational social network analysis.
-- leaders(id, name, birth_year, death_year, era, region)
-- lta_scores(leader_id, B, CC, D, IB, P, A, T, source_text, coder)
-- econ_fingerprint(leader_id, year, gdp_pc_1990, polity_score, source)

SELECT
    l.name,
    s.P   AS need_for_power,
    s.B   AS control_belief,
    s.D   AS distrust,
    s.P - s.D AS trust_power_gap,
    CASE
        WHEN s.D < 0.35 AND s.P > 0.85
            THEN 'HIGH RISK — low distrust + high power'
        ELSE 'within normal range'
    END AS psychonomic_flag
FROM leaders l
JOIN lta_scores s ON l.id = s.leader_id
WHERE l.name = 'Julius Caesar';

SELECT
    l.name,
    s.D AS distrust_score,
    RANK() OVER (ORDER BY s.D ASC) AS distrust_rank_asc
FROM leaders l
JOIN lta_scores s ON l.id = s.leader_id
ORDER BY s.D ASC;

SELECT
    year,
    gdp_pc_1990,
    LAG(gdp_pc_1990, 1) OVER (ORDER BY year) AS prev_gdp,
    ROUND(
        (gdp_pc_1990 - LAG(gdp_pc_1990, 1) OVER (ORDER BY year))
        / LAG(gdp_pc_1990, 1) OVER (ORDER BY year) * 100, 2
    ) AS pct_change
FROM econ_fingerprint
WHERE leader_id = (SELECT id FROM leaders WHERE name = 'Julius Caesar')
   OR (year BETWEEN -200 AND 400 AND region = 'Roman Empire')
ORDER BY year;
import requests, re, pandas as pd
from collections import Counter

url    = "https://www.gutenberg.org/files/10657/10657-0.txt"
text   = requests.get(url).text
start  = text.find("BOOK I")
end    = text.find("End of the Project Gutenberg")
corpus = text[start:end].lower()
words  = re.findall(r'\b[a-z]+\b', corpus)
total  = len(words)

lta_dicts = {
    "power_words":           ["command","ordered","decided","caesar","authority",
                              "conquered","victory","forced","compelled","demanded"],
    "distrust_words":        ["treachery","betrayal","enemy","suspicious","deceit",
                              "ambush","perfidy","cunning","trap","feared"],
    "complexity_words":      ["however","although","nevertheless","despite","whereas"],
    "task_words":            ["march","bridge","fortify","supply","route","position"],
    "first_person":          ["i","me","my","mine","myself"],
    "third_person_caesar":   ["caesar","he","him","his"]
}

word_counts = Counter(words)
scores = {cat: round(sum(word_counts.get(w,0) for w in wl) / total * 1000, 2)
          for cat, wl in lta_dicts.items()}

fp_rate = scores["first_person"]
tp_rate = scores["third_person_caesar"]
ratio   = round(tp_rate / fp_rate, 2) if fp_rate > 0 else float('inf')
print(f"Third-person 'Caesar': {tp_rate} | First-person 'I/me': {fp_rate} | Ratio: {ratio}")
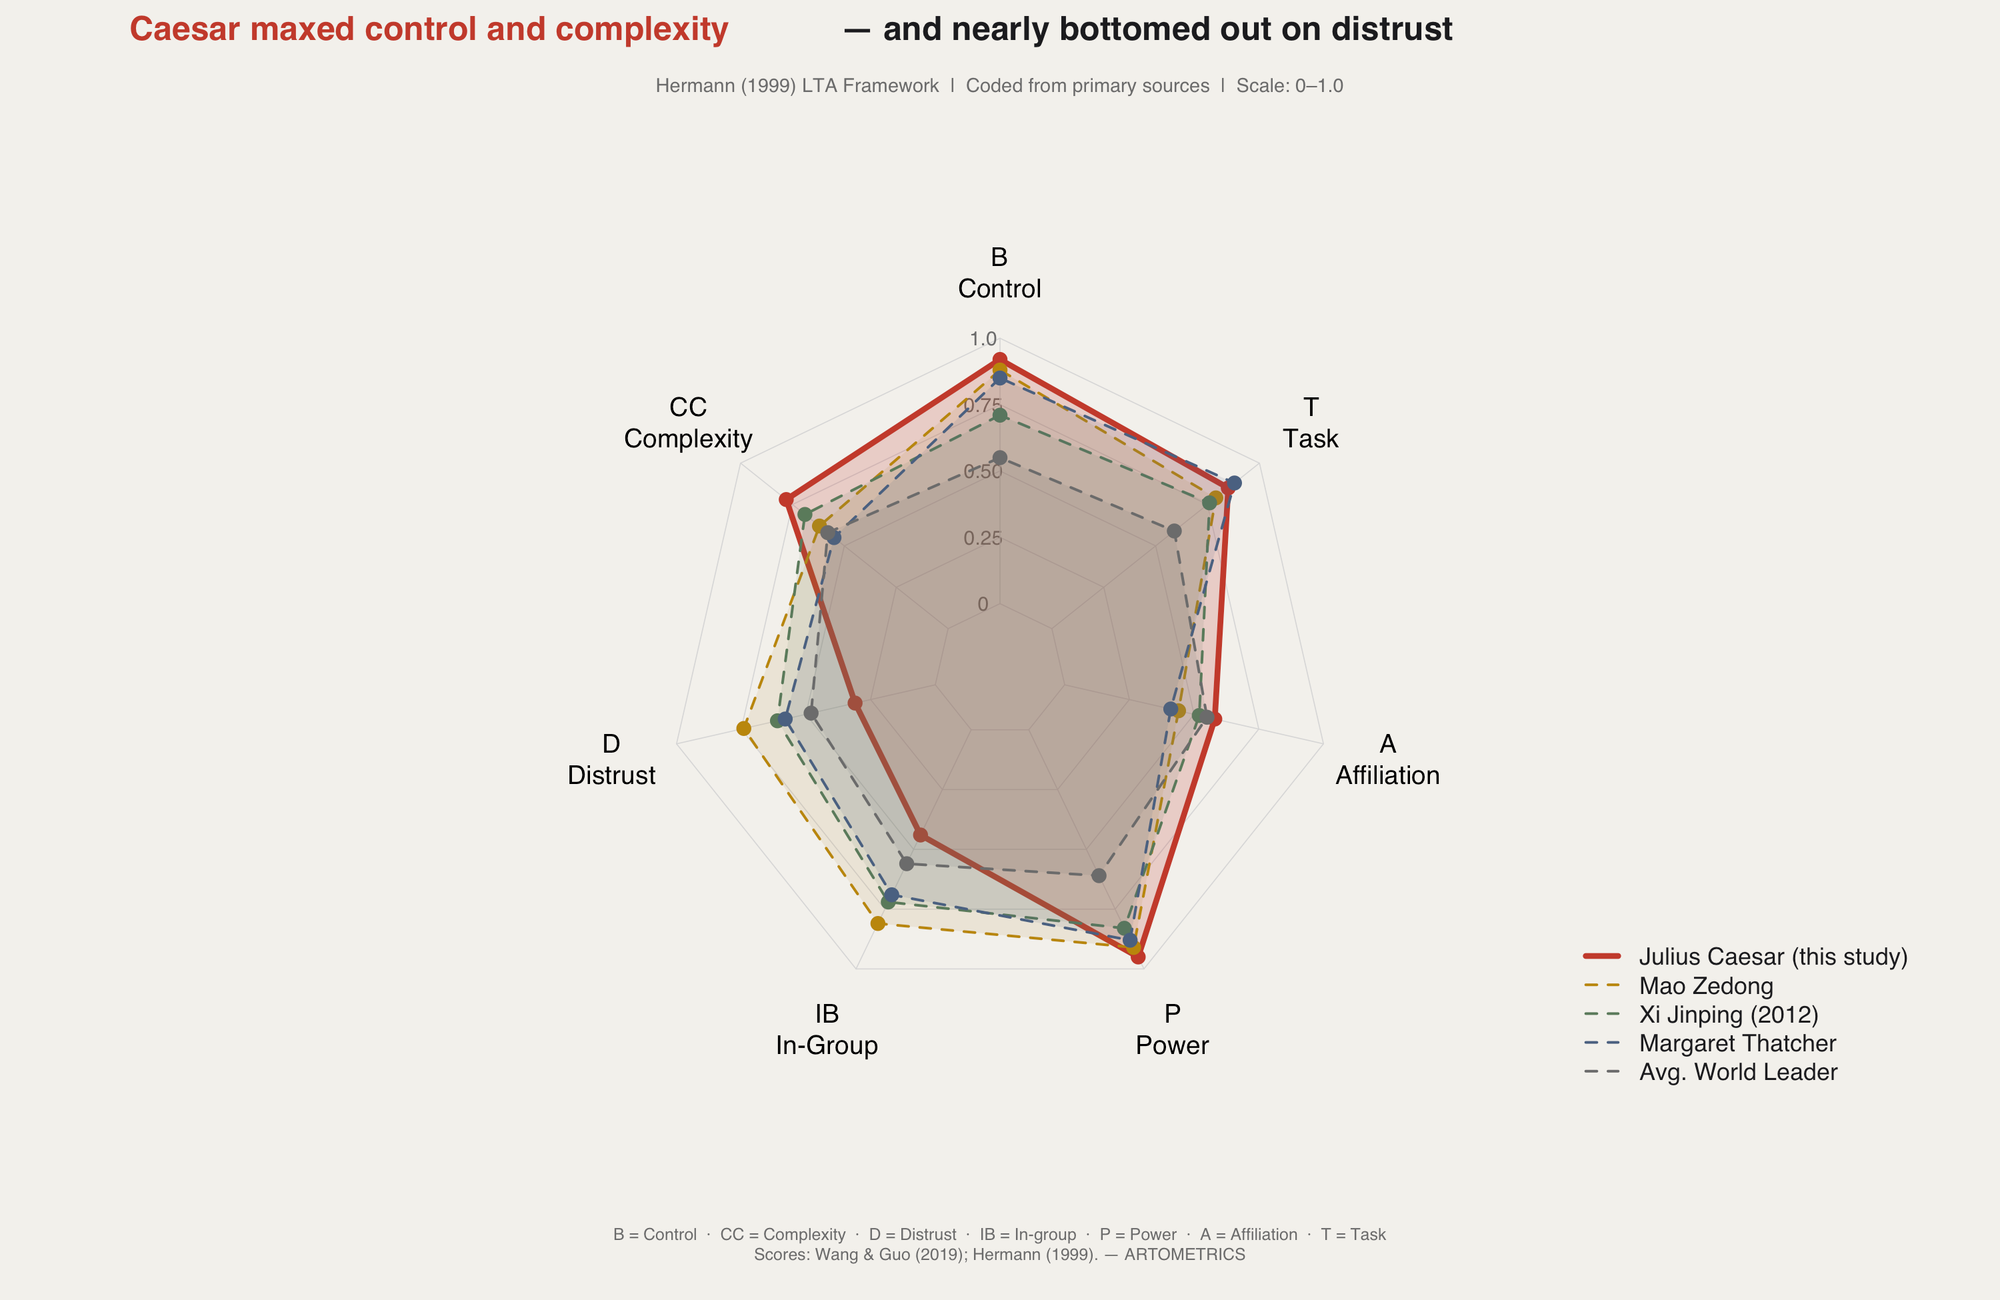
Caesar's LTA profile has a distinctive asymmetric shape that makes the psychonomic argument visible before you read a word. Two variables spike toward the outer ring — Need for Power (P = 0.95) and Belief in Ability to Control Events (B = 0.92). One variable collapses toward the center — Distrust of Others (D = 0.31). That triangle is the architecture of his career. He believed, with near-total conviction, that he could personally determine outcomes and that he should be the one doing so. He also extended trust readily and withdrew it slowly. The combination is extraordinarily effective — until the people you trust decide the same values you embody apply to removing you.
Caesar exceeds the average world leader baseline on every variable except Distrust, where he falls dramatically below average (0.31 vs. 0.48). He was not a more extreme version of a normal leader. He was a normal leader in every domain, but with pathologically low distrust and pathologically high power-need running simultaneously. Mao's comparison is instructive: Mao scores 0.74 on Distrust and 0.81 on In-Group Bias — the two variables that explain the Cultural Revolution. Both men scored near-ceiling on Need for Power. Mao purged. Caesar pardoned. Mao's successors had to dismantle his cult brick by brick. Caesar's successors built an empire on his name.
The single most important number on this chart is D = 0.31. It is not a character flaw and it is not a strength. It is a network architecture decision. A leader who extends trust this freely, at this level of power concentration, is building a system with no redundancy. Every node that fails hits the center directly. Chart 3 shows what that looks like when three nodes fail at once.
library(fmsb)

lta_data <- data.frame(
  B  = c(1.0,0.0,0.92,0.88,0.71,0.85,0.55),
  CC = c(1.0,0.0,0.78,0.62,0.69,0.55,0.58),
  D  = c(1.0,0.0,0.31,0.74,0.61,0.58,0.48),
  IB = c(1.0,0.0,0.44,0.81,0.72,0.69,0.56),
  P  = c(1.0,0.0,0.95,0.91,0.83,0.88,0.61),
  A  = c(1.0,0.0,0.58,0.44,0.52,0.41,0.55),
  T  = c(1.0,0.0,0.85,0.79,0.76,0.88,0.59)
)
rownames(lta_data) <- c("Max","Min","Julius Caesar","Mao Zedong",
                         "Xi Jinping (2012)","Margaret Thatcher","Avg. World Leader")

png("charts/chart1_lta_radar.png", width=3000, height=1950, res=300, bg=art_cream)
par(bg=art_cream, mar=c(5,2,6,2), family="sans")
radarchart(lta_data, axistype=1, seg=4,
           pcol=line_colors, pfcol=fill_colors,
           plwd=line_widths, plty=line_types,
           cglcol=art_muted, cglty=1, cglwd=0.5,
           axislabcol=art_mid, vlabels=axis_labels, vlcex=0.78,
           caxislabels=c("0","0.25","0.50","0.75","1.0"), calcex=0.60, title="")
mtext("Caesar maxed control and complexity",
      side=3, line=4.8, cex=1.0, col=art_highlight, font=2, adj=0.04)
mtext("— and nearly bottomed out on distrust",
      side=3, line=4.8, cex=1.0, col=art_dark, font=2, adj=0.62)
dev.off()
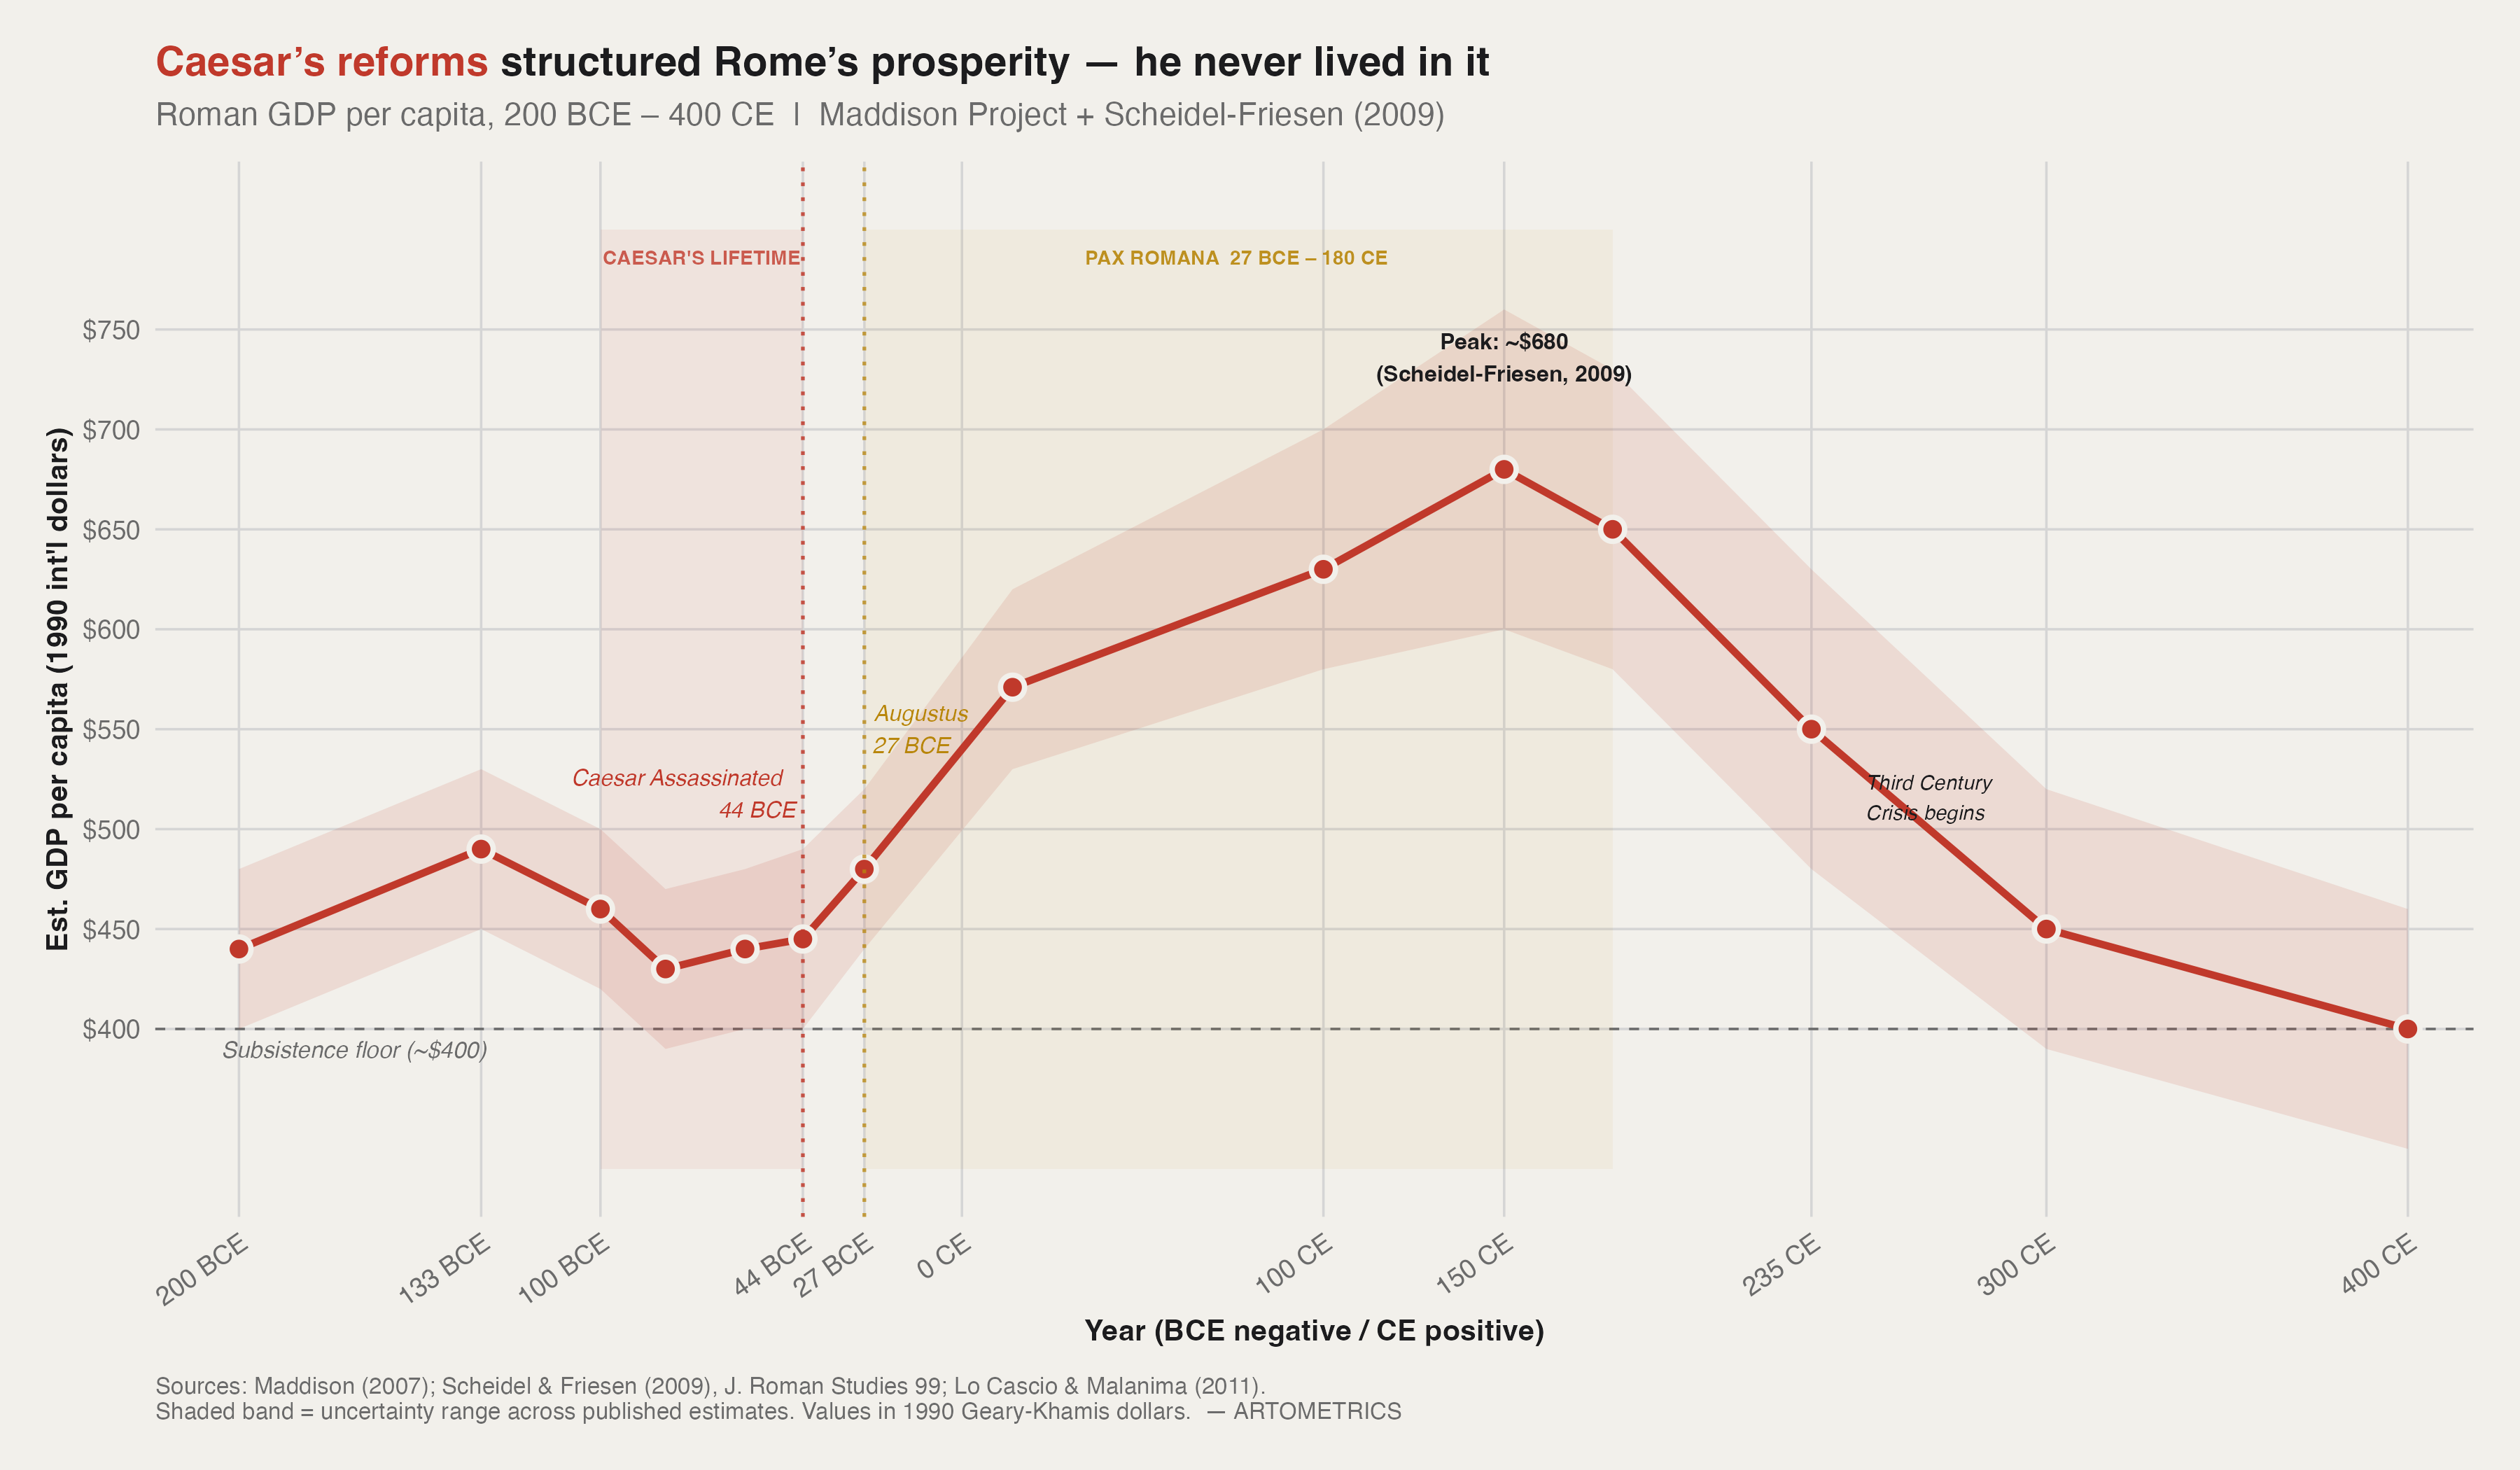
The most important feature of this chart is not Caesar's era — it is what comes after it. Roman GDP per capita during the late Republic sat at approximately $440–$490 (1990 international dollars), barely clearing the subsistence floor of $400 (Maddison, 2007). This was not a prosperous society on a per-person basis. The Scheidel-Friesen (2009) income distribution model places the top 1.5% of Romans capturing roughly 20% of all income, with the vast majority living near subsistence. Grain supply chains failed regularly. Debt bondage was common. The fiscal machinery of the Republic was increasingly captured by the same factions fighting civil wars for control of it.
Caesar's dictatorship lasted less than five years — 49 to 44 BCE. His reforms held after his death, but the GDP data shows no immediate uplift. The economy barely moves during Caesar's lifetime. It moves under Augustus, who took Caesar's policies and embedded them in institutions designed to outlive any individual: the principate, the imperial cult, the professional army with fixed terms and state pensions. From Augustus's consolidation (27 BCE) to Trajan (100 CE), Roman GDP per capita rose roughly 30% — from ~$480 to ~$630. The Scheidel-Friesen peak of ~$680 at 150 CE, Rome at its maximum economic output, came 194 years after Caesar's assassination.
This is the psychonomic paradox the chart makes numerical. Caesar's theory of power was that the self could substitute for institutional architecture — that personal authority, sufficiently magnanimous and forceful, was durable enough to hold the gains he made. Augustus understood what Caesar did not. He built the house so that no single soul was load-bearing. Caesar authored the prosperity line. Augustus inhabited it. The distance between the assassination marker and the GDP peak is not a tragedy of timing. It is the measurement of the difference between the two men's theories of power.
rome_gdp <- data.frame(
  year     = c(-200,-133,-100,-82,-60,-44,-27,14,100,150,180,235,300,400),
  gdp      = c(440,490,460,430,440,445,480,571,630,680,650,550,450,400),
  gdp_low  = c(400,450,420,390,400,400,440,530,580,600,580,480,390,340),
  gdp_high = c(480,530,500,470,480,490,520,620,700,760,730,630,520,460)
)

p2 <- ggplot(rome_gdp, aes(x=year, y=gdp)) +
  geom_ribbon(aes(ymin=gdp_low, ymax=gdp_high), fill=art_highlight, alpha=0.12) +
  geom_line(color=art_highlight, linewidth=1.2) +
  geom_point(color=art_cream, fill=art_highlight, shape=21, size=3.0, stroke=1.3) +
  labs(
    title   = "Caesar's reforms structured Rome's prosperity — he never lived in it",
    subtitle = "Roman GDP per capita, 200 BCE – 400 CE  |  Maddison Project + Scheidel-Friesen (2009)",
    caption  = "Sources: Maddison (2007); Scheidel & Friesen (2009); Lo Cascio & Malanima (2011).  — ARTOMETRICS"
  ) +
  theme_artometrics()

ggsave("chart2_rome_gdp.png", plot=p2, path="charts", width=12, height=7, dpi=300, bg=art_cream)
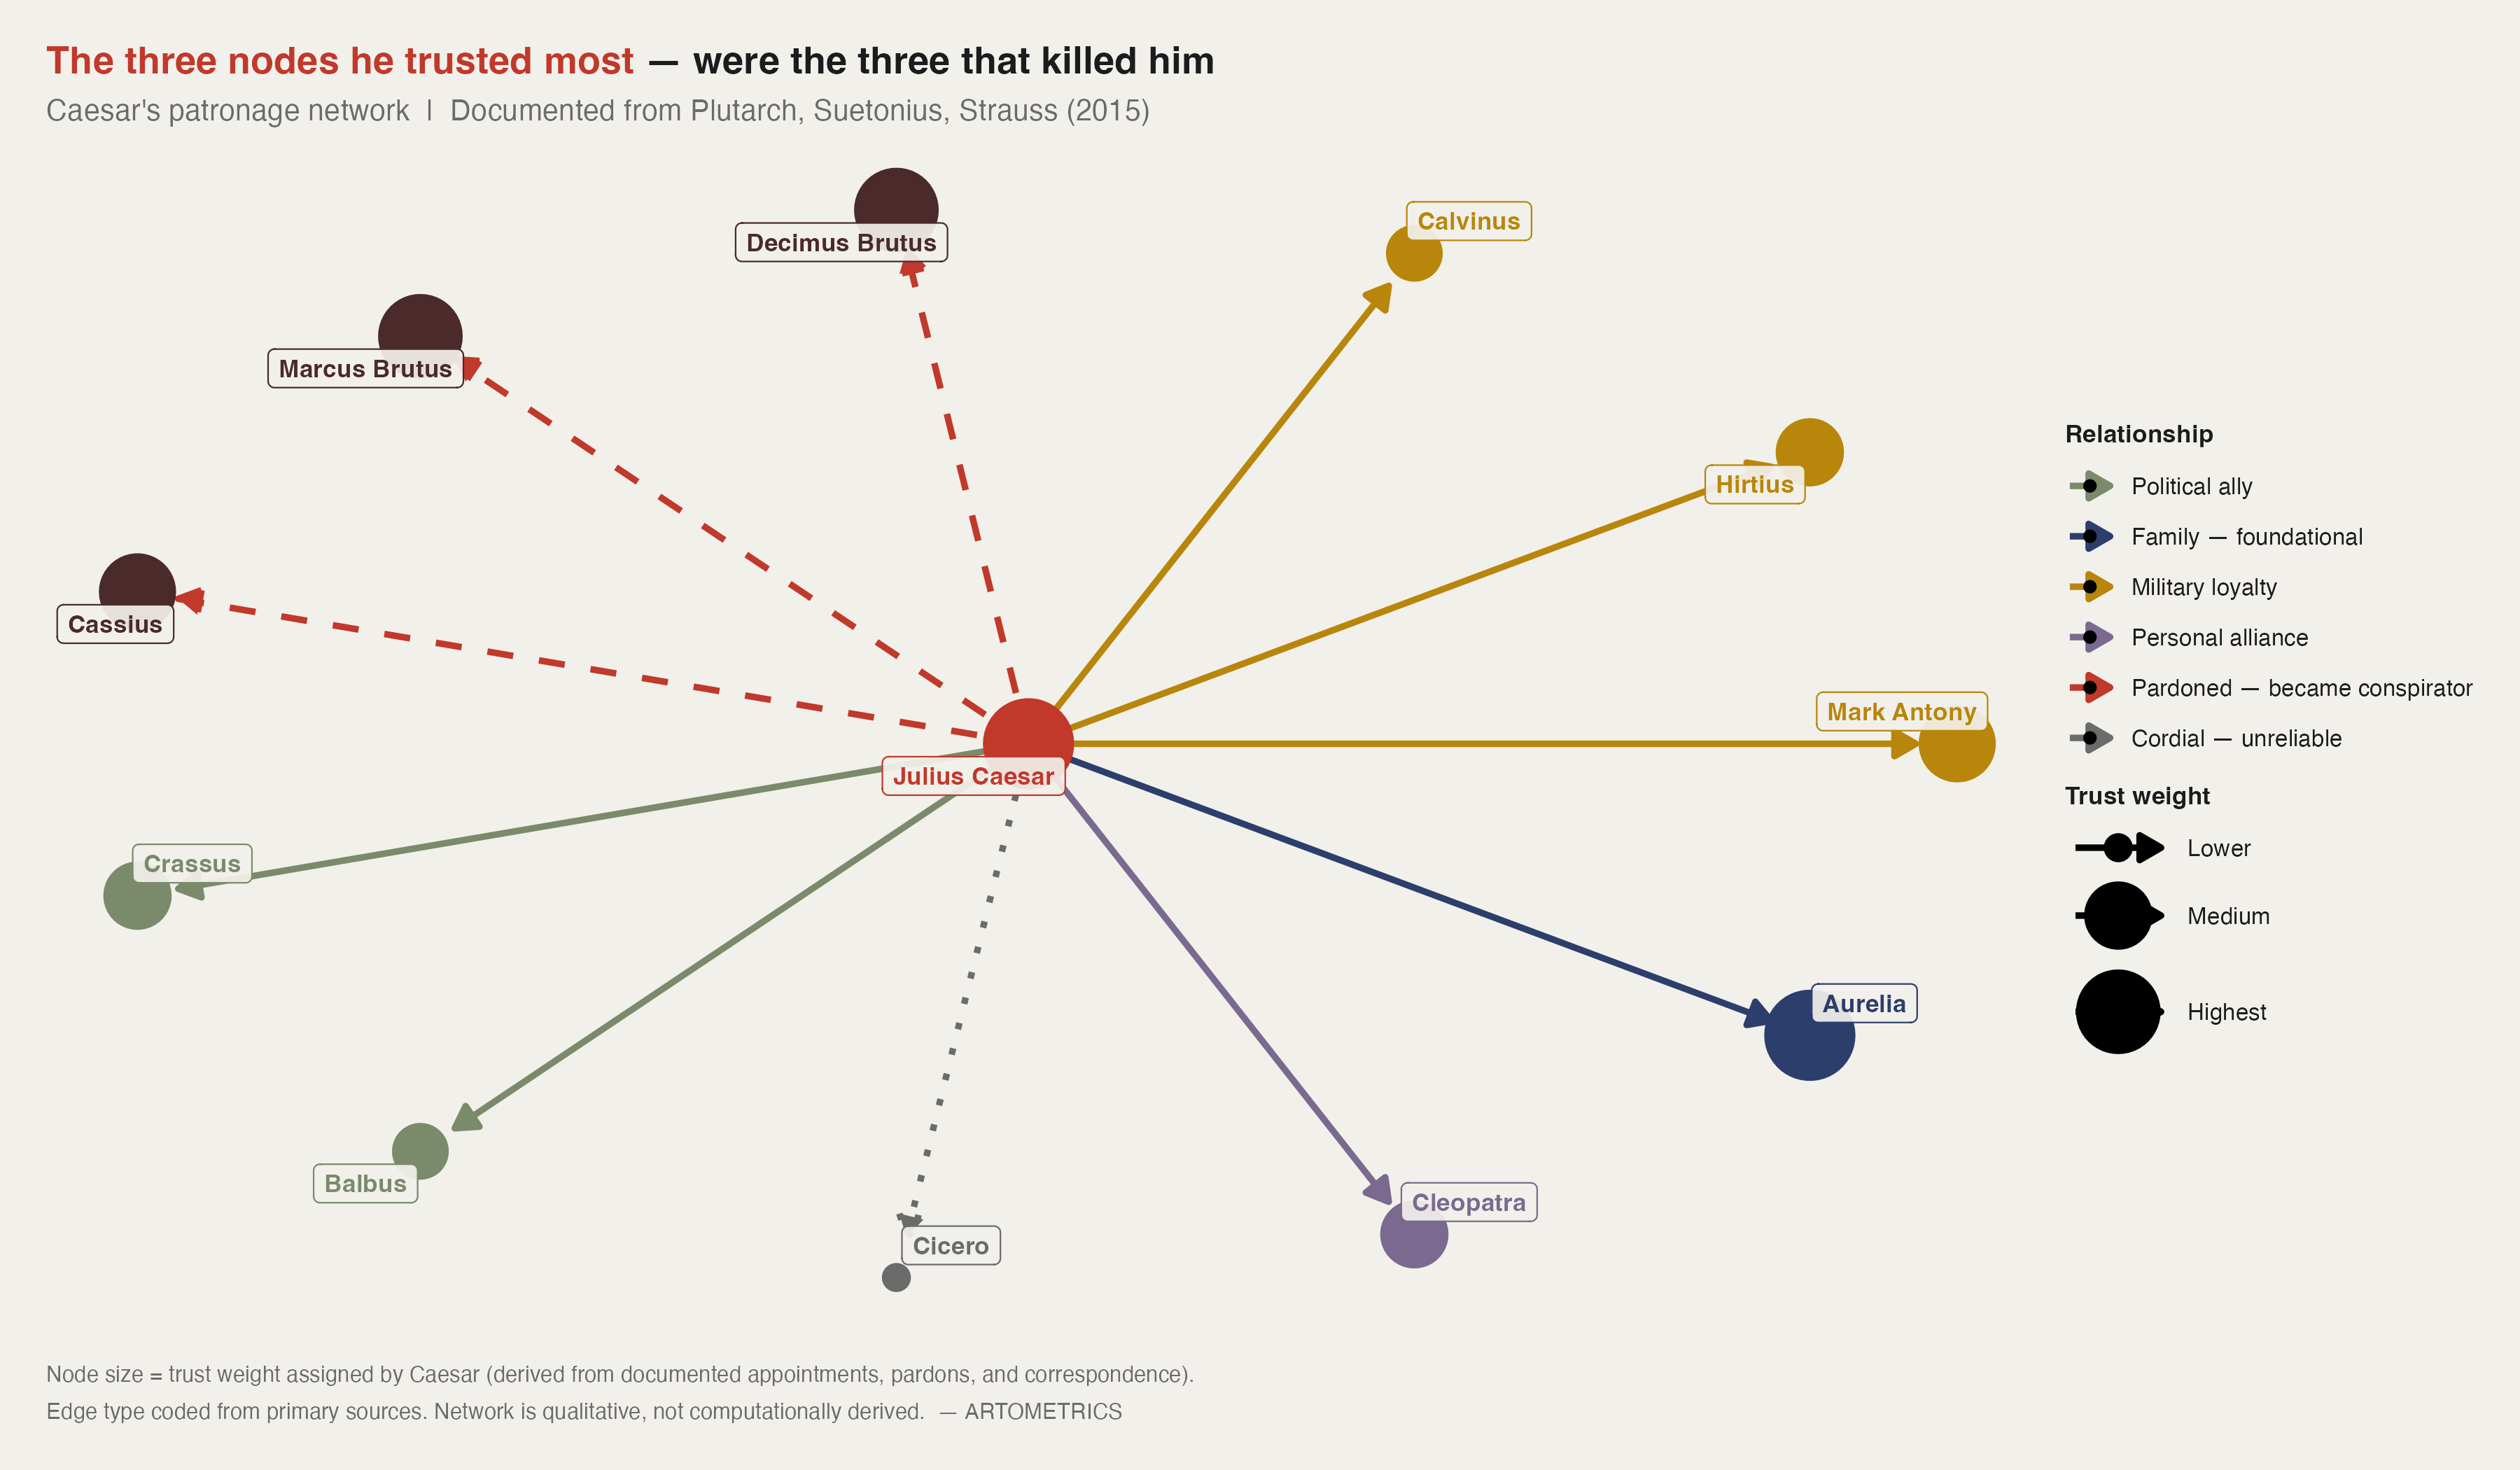
The network chart makes the psychonomic argument structural. Every edge connects to Caesar at the center. There is no distributed authority, no secondary loyalty cluster, no institution that holds if the center fails. This is not how republics are supposed to work — it is how patronage networks work when one person has absorbed enough of the Republic into themselves that the two become indistinguishable. Caesar did not intend to build a fragile system. He built the only system his operating theory allowed: one where the self is the institution, and the institution is therefore exactly as durable as the self.
The three dashed red edges are the chart's payload. Decimus Brutus was in Caesar's inner military circle — the general he trusted as much as Antony. Marcus Brutus had fought against Caesar in the civil war, been pardoned, been given the praetorship, and been promised a future consulship. Cassius had done the same. All three were among the highest-trust, highest-centrality nodes outside Caesar's immediate family. Decimus Brutus was the man who physically escorted Caesar to the Senate on the morning of March 15, 44 BCE, after Caesar had considered staying home. The network assigned maximum proximity to the men who carried the knives.
Caesar's D score of 0.31 on Chart 1 was not naivety. It was the logical extension of his core belief: that he could convert anyone through the experience of his own magnanimity. He was, in the vast majority of cases, correct. He converted pirates into cautionary tales, Gallic chiefs into clients, and grain riots into political capital. The failure mode is right there in the chart. Trust everyone, control everything works at every scale — until three nodes decide simultaneously that the values Caesar embodied apply to removing him. There was no redundancy to absorb it.
library(igraph); library(ggraph); library(tidygraph)

nodes <- data.frame(
  name     = c("Julius Caesar","Mark Antony","Hirtius","Calvinus",
                "Decimus Brutus","Marcus Brutus","Cassius",
                "Crassus","Balbus","Cicero","Cleopatra","Aurelia"),
  category = c("Caesar","Military Loyal","Military Loyal","Military Loyal",
                "Pardoned — Conspirator","Pardoned — Conspirator","Pardoned — Conspirator",
                "Political Ally","Political Ally","Cordial — Unreliable",
                "Personal Alliance","Family — Foundational"),
  trust    = c(10,8,7,6,9,9,8,7,6,5,7,10)
)
edges <- data.frame(
  from      = rep("Julius Caesar", 11),
  to        = c("Mark Antony","Hirtius","Calvinus","Decimus Brutus",
                 "Marcus Brutus","Cassius","Crassus","Balbus",
                 "Cicero","Cleopatra","Aurelia"),
  edge_type = c("loyal","loyal","loyal","risk","risk","risk",
                 "ally","ally","weak","personal","family")
)

g  <- tbl_graph(nodes=nodes, edges=edges, directed=TRUE)
p3 <- ggraph(g, layout="star", center="Julius Caesar") +
  geom_edge_link(aes(color=edge_type, linetype=edge_type), linewidth=1.05,
                 arrow=arrow(length=unit(3,"mm"), type="closed"), end_cap=circle(5,"mm")) +
  geom_node_point(aes(color=category, size=trust)) +
  geom_node_label(aes(label=name, color=category), repel=TRUE, size=3.0,
                  fontface="bold", label.size=0, fill=art_cream, alpha=0.92) +
  labs(
    title    = "The three nodes he trusted most — were the three that killed him",
    subtitle = "Caesar's patronage network  |  Documented from Plutarch, Suetonius, Strauss (2015)",
    caption  = "Node size = trust weight. Edge type coded from primary sources. Network is qualitative.  — ARTOMETRICS"
  )

ggsave("chart3_patronage_network.png", plot=p3, path="charts", width=12, height=7, dpi=300, bg=art_cream)
This report applies the Leadership Trait Analysis framework — developed for living leaders with large, verifiable speech corpora — to an ancient figure whose primary text is self-authored political propaganda. The Commentarii de Bello Gallico was written by Caesar during the campaigns it describes, distributed to a Roman political audience, and never intended as an impartial record. LTA scores derived from it likely underestimate Distrust (since trust is the policy Caesar publicly advertised) and may overestimate Conceptual Complexity (since nuance served his rhetorical interests). These biases should be read as a floor and ceiling, not as distortions that invalidate the analysis. The LTA scores in this report reflect the psychological signature Caesar projected and acted upon — which is precisely what Psychonomics requires.
The Roman GDP series carries wide uncertainty intervals before 14 AD, the earliest reliable Maddison Project anchor. All pre-Augustus estimates are reconstructed from indirect evidence — grain prices, wage records from Egyptian papyri, archaeological trade volume proxies, and demographic models. Scheidel himself cautions that ancient GDP estimates can only be regarded as rough approximations given the paucity of surviving data. The GDP chart in this report should be read as a directional argument — the shape of the trajectory and its inflection points relative to Caesar's era — not as a claim to precision at the level of individual data points.
The patronage network is qualitatively constructed from primary sources, not computationally derived from a social network dataset. Edge types and trust weights reflect documented historical events (appointments, pardons, correspondence) and the scholarly consensus drawn from Plutarch, Suetonius, and Strauss (2015). The network cannot capture relationships we don't have records of, and it represents a snapshot of Caesar's final years rather than the evolution of his alliances over time. A complete Psychonomics database — with multiple figures and longitudinal network data — would allow more rigorous comparative claims. That database is the long-run goal of this series.
Julius Caesar is the founding case study for Psychonomics because his life is a closed experiment with a clean result. We have his biography in granular detail, his own writings, three independent ancient accounts, and 2,000 years of institutional outcomes to measure against his decisions. The experiment result is unambiguous: the man who genuinely reformed Roman debt law, redistributed land to 80,000 veterans and poor, stabilized grain supply, rebuilt the calendar, and laid the administrative foundation of a 500-year empire never lived in the house he built. He was killed by the men he trusted most, using the values he had taught them, nineteen months after declaring himself dictator for life.
The three charts tell the same story from three angles. The LTA radar shows the psychological architecture — the specific combination of near-ceiling power-need and near-floor distrust that made Caesar simultaneously extraordinary and structurally exposed. The GDP series shows the economic gap — Caesar in the flat zone of the late Republic, Augustus and his successors riding the 30% growth curve built on Caesar's institutional reforms. The patronage network shows the mechanism — the dashed red edges pointing directly at the center, maximum trust assigned to the maximum-risk nodes, no redundancy, no institutional buffer between Caesar's confidence and its consequences.
Economics tracks how houses are managed. Psychonomics asks who is managing the soul of the house — and what it costs. In Caesar's case, the cost was paid by everyone who came after him, and they built something extraordinary with it. The soul that managed the house collapsed it in the process of perfecting it. The house that replaced it was built to survive without him, and it did — for fifteen centuries in the East, five in the West, and indefinitely in the calendar we still use today.
Bolt, J., & van Zanden, J.L. (2020). Maddison Project Database, version 2020. University of Groningen.
Caesar, J. (58–50 BCE). Commentarii de Bello Gallico. Trans. W.A. McDevitte & W.S. Bohn. Project Gutenberg.
Cicero, M.T. (46 BCE). Brutus.
Dyson, S.B. (2006). Personality and foreign policy: Tony Blair's Iraq decisions. Foreign Policy Analysis, 2(3), 289–306.
Goldsworthy, A. (2006). Caesar: Life of a Colossus. Yale University Press.
Hermann, M.G. (1999). Assessing Leadership Style: A Trait Analysis. Social Science Automation.
Lo Cascio, E., & Malanima, P. (2011). Ancient and pre-modern economies: GDP in the Roman Empire and early modern Europe. Conference on Quantifying Long Run Economic Development, Venice.
Maddison, A. (2007). Contours of the World Economy 1–2030 AD. Oxford University Press.
Milanovic, B., Lindert, P.H., & Williamson, J.G. (2011). Pre-industrial inequality. The Economic Journal, 121(551), 255–272.
Pliny the Elder. Naturalis Historia, 7.54.
Plutarch. (c. AD 100). Parallel Lives: Caesar. Trans. Robin Seager. Penelope/University of Chicago.
Post, J.M. (2004). Leaders and Their Followers in a Dangerous World. Cornell University Press.
Scheidel, W., & Friesen, S.J. (2009). The size of the economy and the distribution of income in the Roman Empire. Journal of Roman Studies, 99, 61–91.
Strauss, B. (2015). The Death of Caesar: The Story of History's Most Famous Assassination. Simon & Schuster.
Suetonius. (c. AD 121). The Twelve Caesars: Divus Julius. Trans. Robert Graves. Penguin Classics.
Wang, X., & Guo, Y. (2019). Leadership trait analysis of Chinese Communist leaders. Journal of Chinese Political Science, 24(3).
This report was researched and written with the assistance of AI tools for structural analysis, data synthesis, and drafting. All citations were verified against primary and peer-reviewed secondary sources. Leadership Trait Analysis scores were coded by the author using the Hermann (1999) rubric applied to primary source texts; they represent expert coding, not computational output. Roman GDP estimates are drawn directly from published academic sources and presented with their documented uncertainty ranges. The Psychonomics framework — applying behavioral economics methodology to historical and contemporary leadership profiles — is an original contribution of Artometrics. Readers are encouraged to follow the source citations and form their own conclusions.
— Artometrics Editorial
This report is part of the Psychonomics series by Artometrics — profiles of historical and contemporary figures through the lens of behavioral economics and leadership psychology. The full dataset, R code, and chart files are on GitHub.